A Transfer of regulatory knowledge from human to mouse for functional genomics analysis
A.1 Supplementary Figures
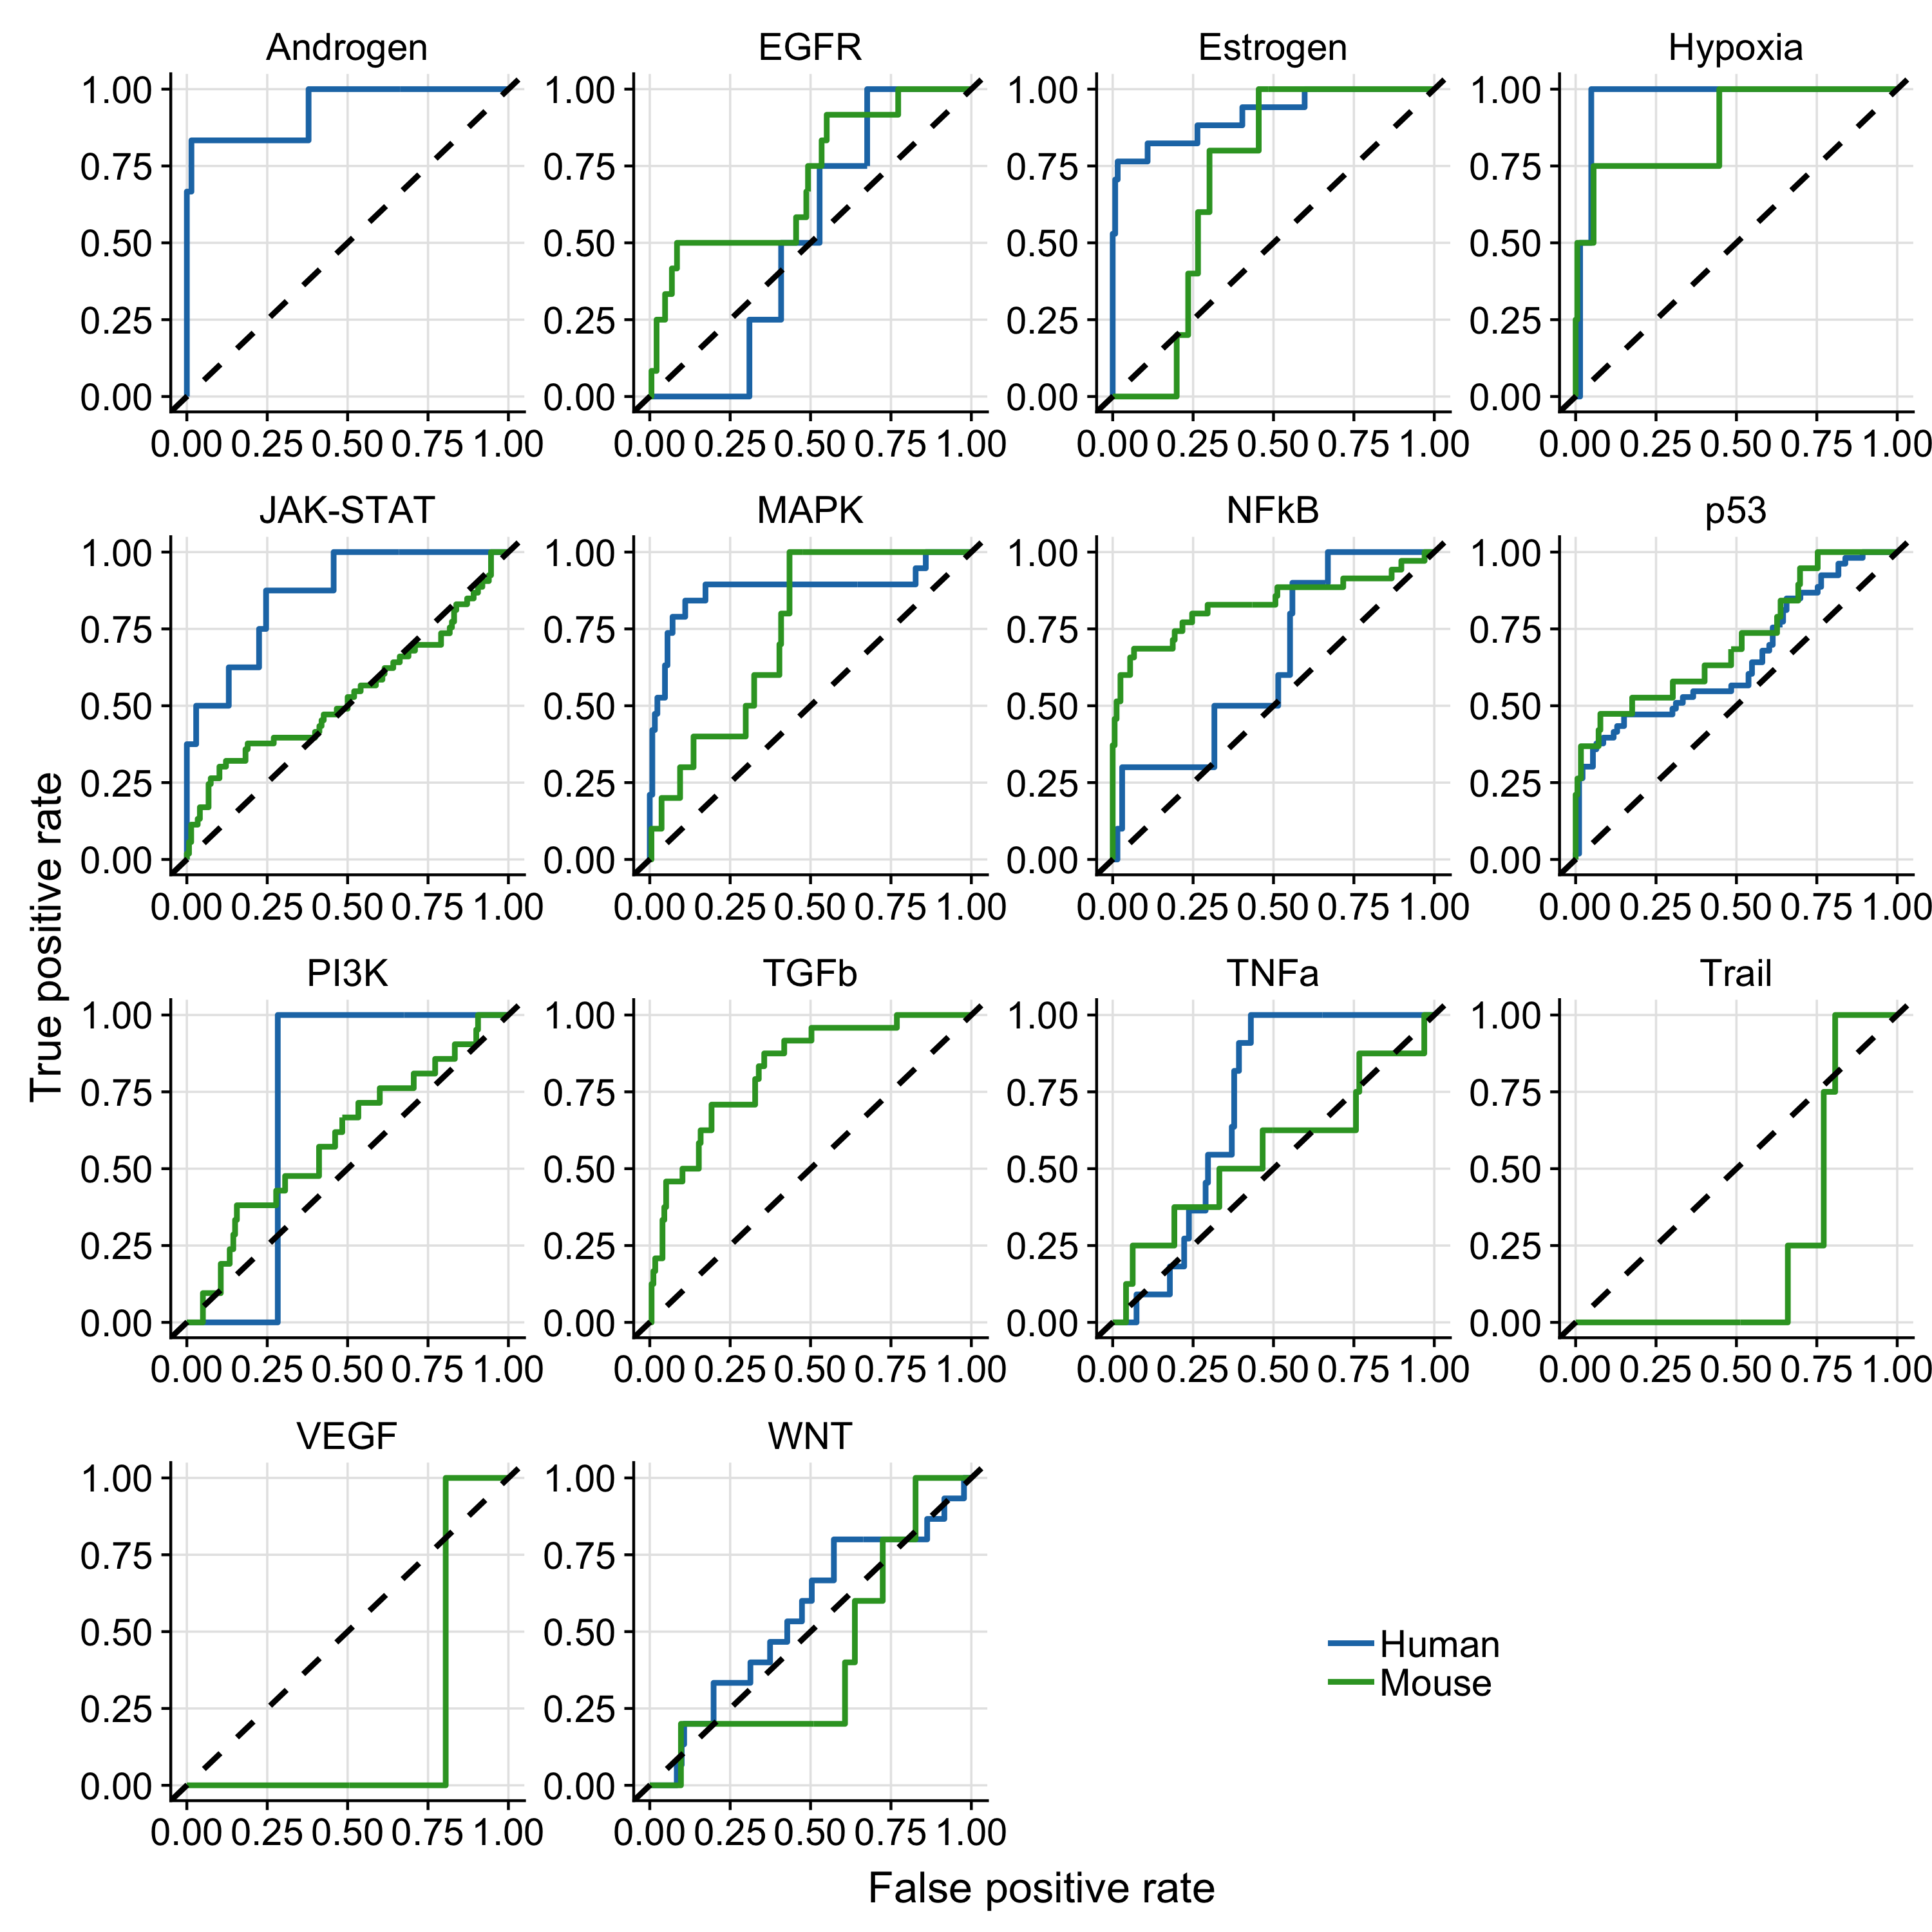
Figure A.1: Results of pathway-wise ROC-curves analysis. The dashed line indicate the performance of a random model. Missing mouse or human ROC-curves are due to missing benchmark data for the corresponding pathway.
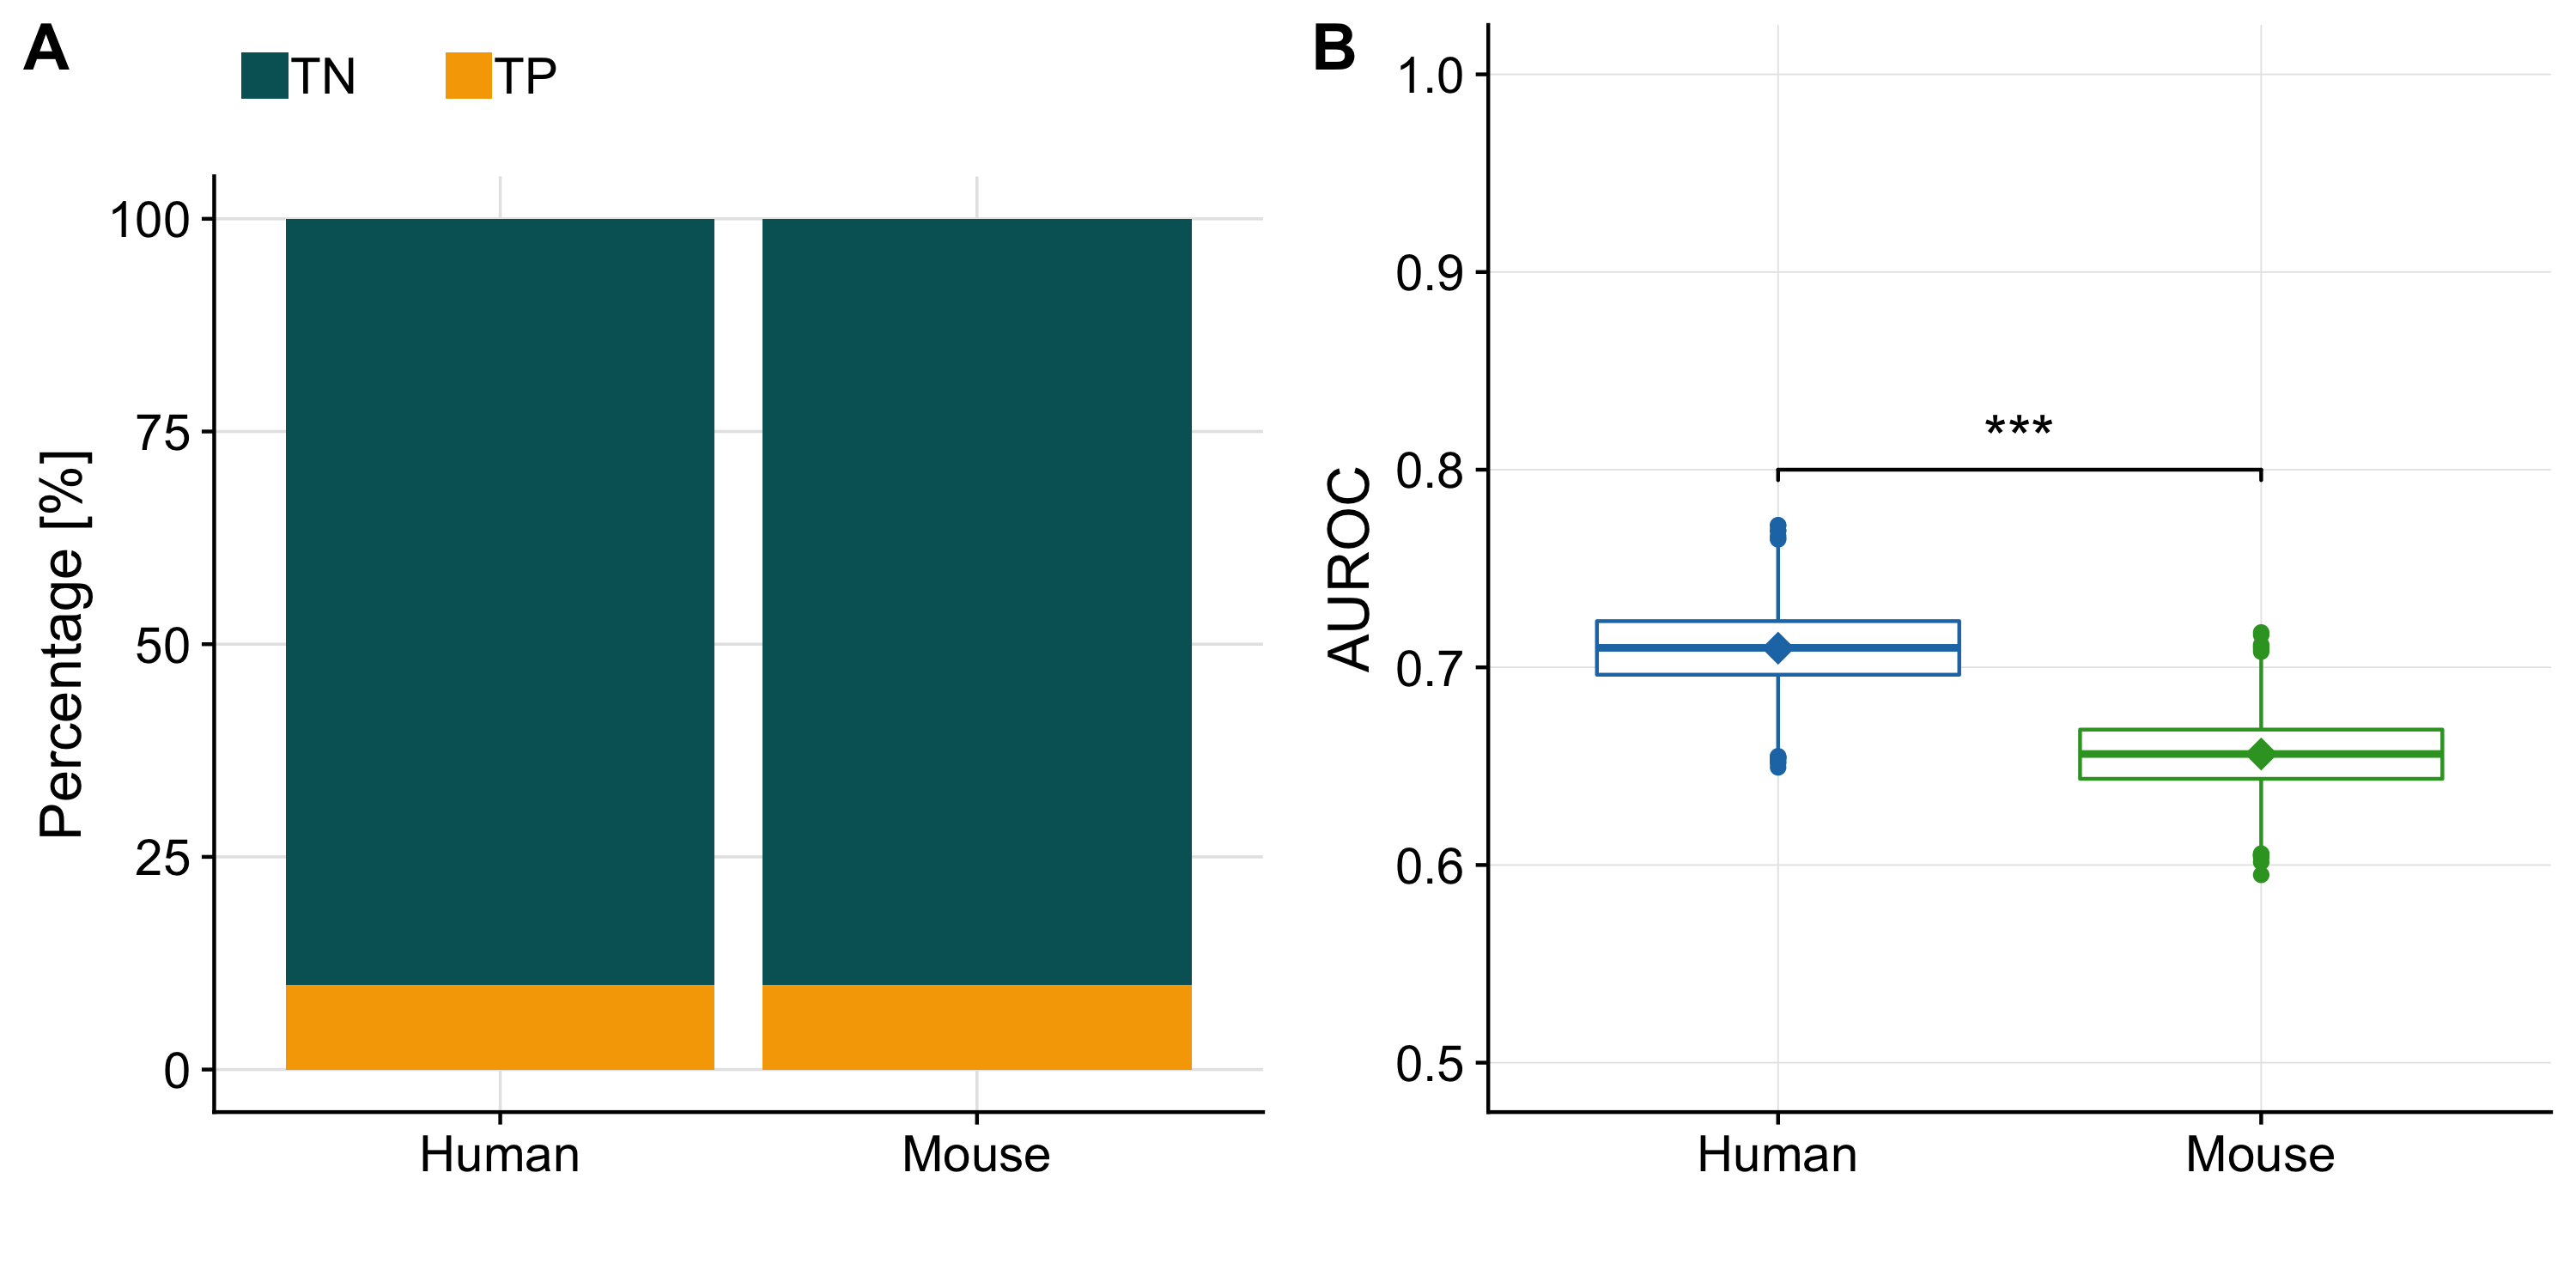
Figure A.2: (A) Barplot showing the imbalance of true negatives (TN) and true positives (TP) in our benchmark dataset for human and mouse. (B) Distribution of AUROC’s computed for human and mouse separately from a balanced dataset (generated by downsampling the TN to equal the number of TP). The diamonds indicate the AUROC of the unbalanced dataset.
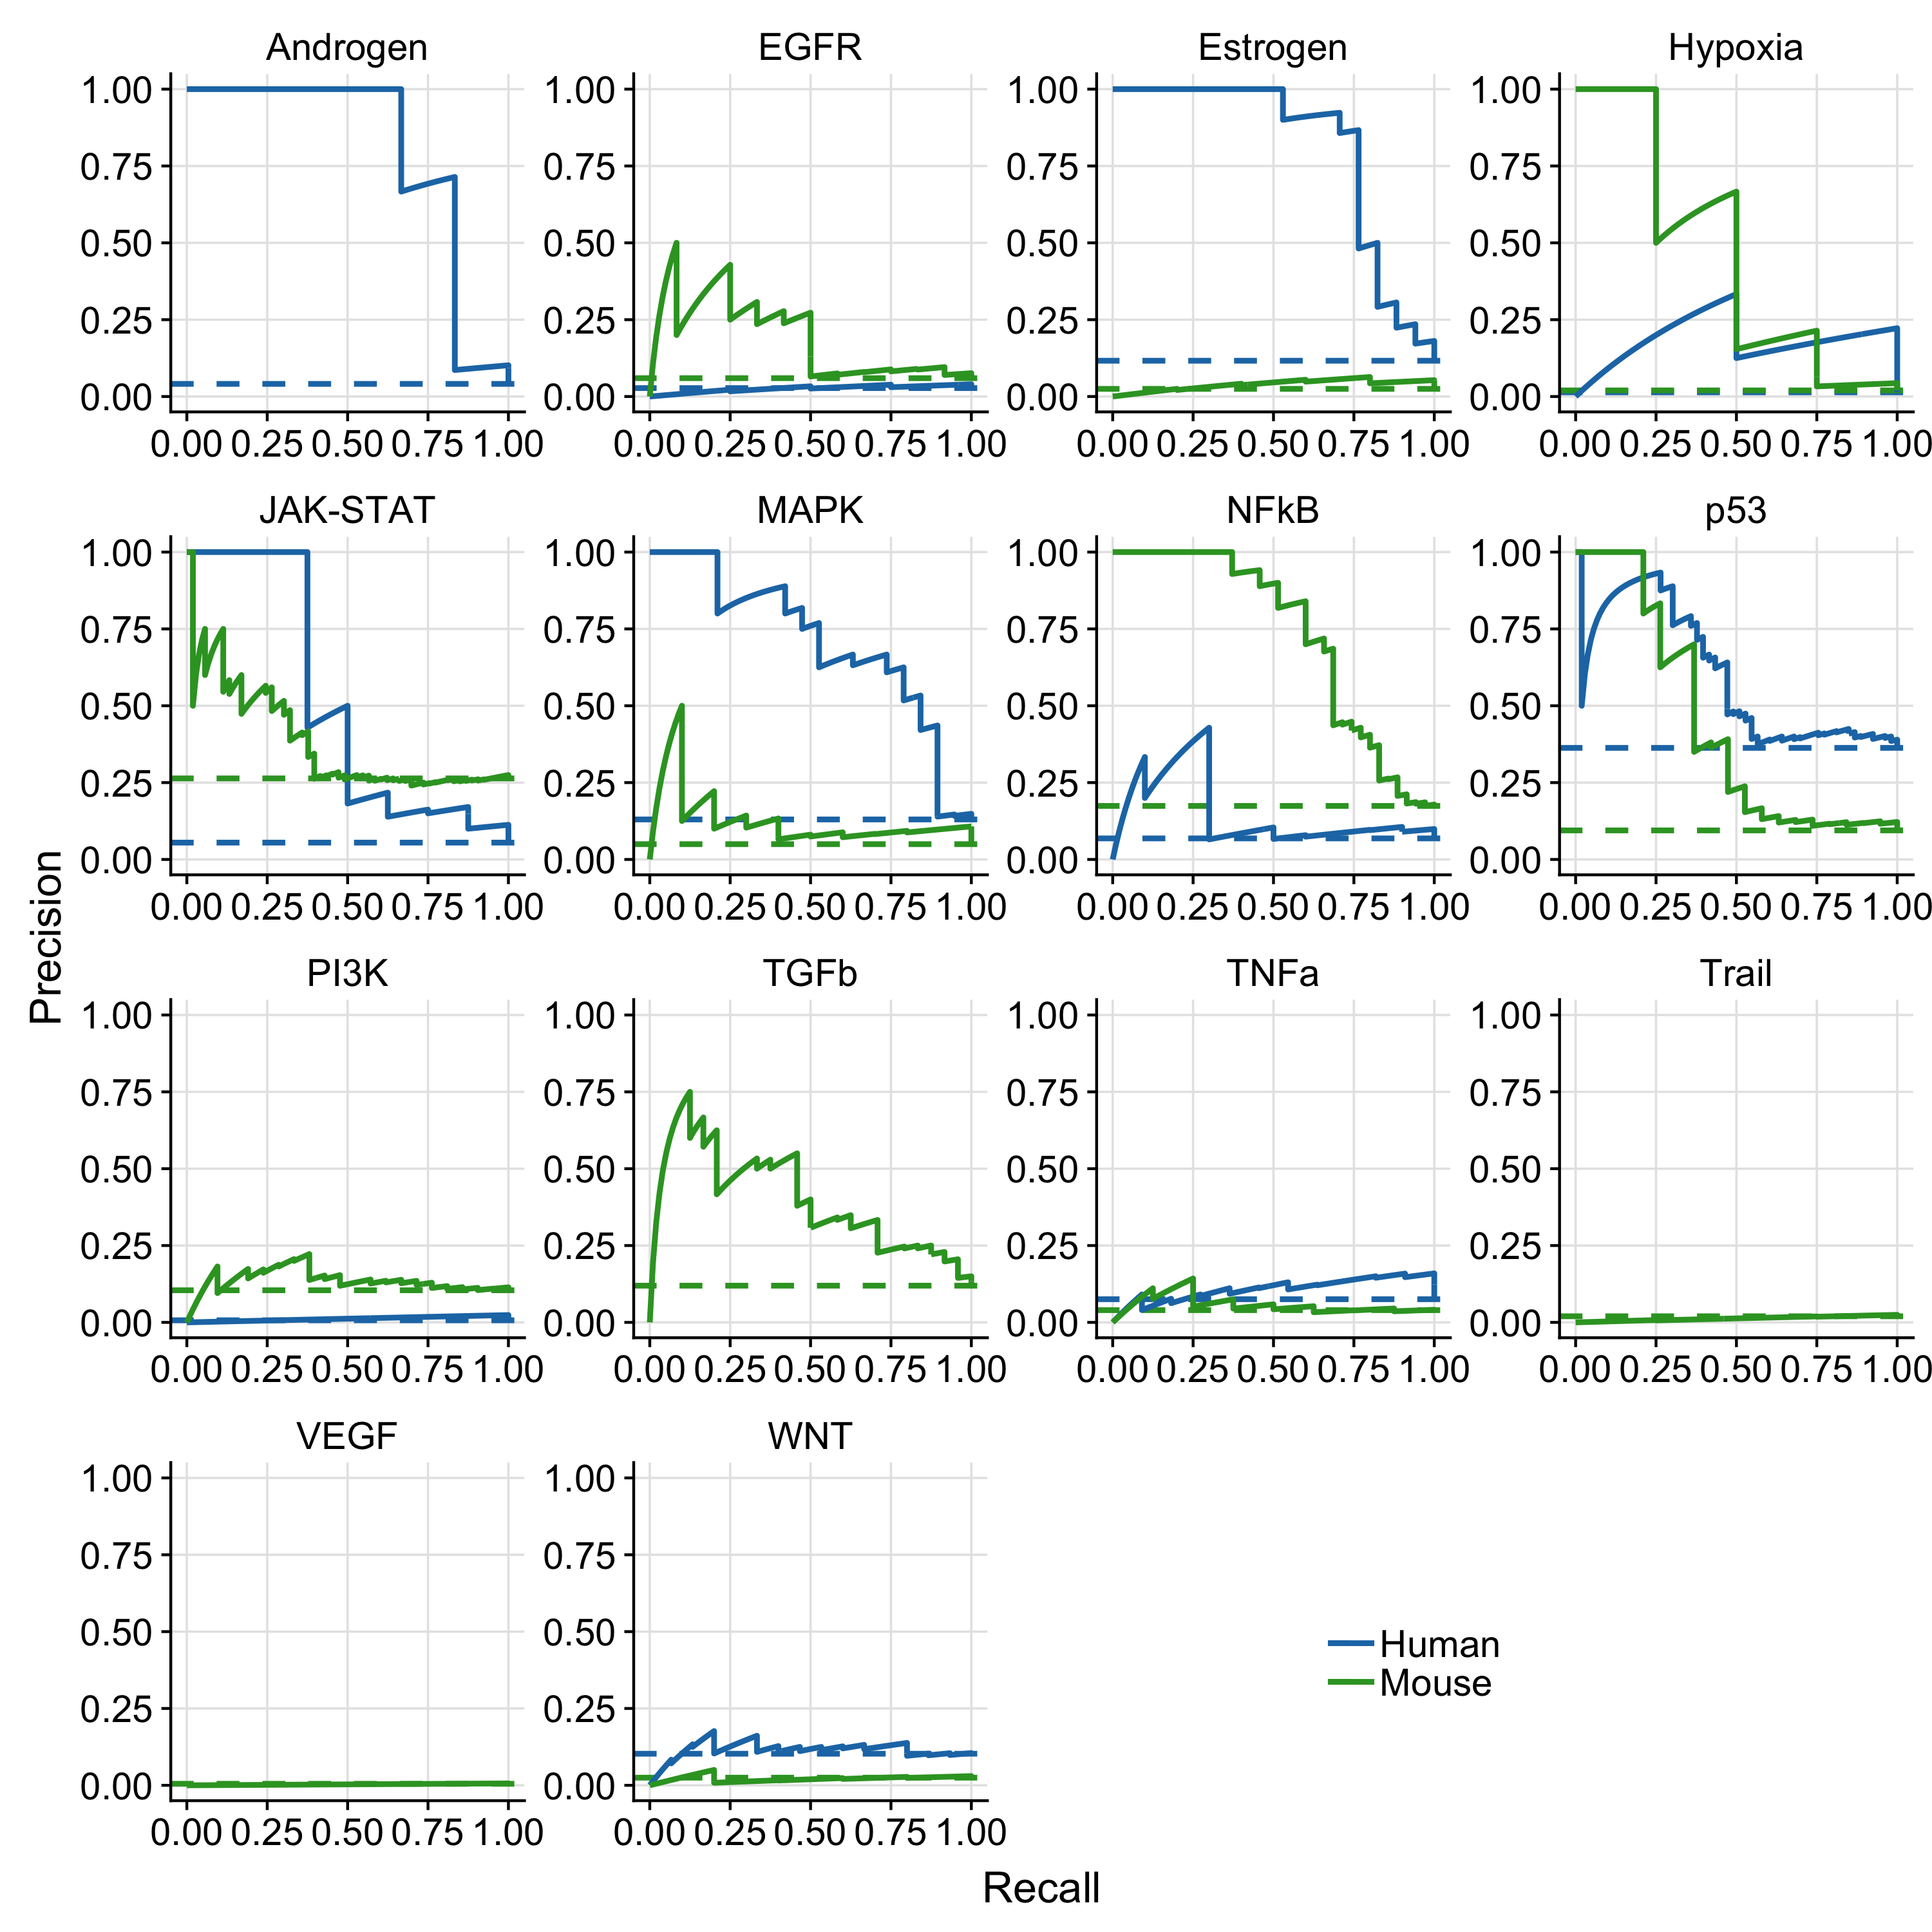
Figure A.3: Results of pathway-wise PR-curves analysis. The dashed line indicates the performance of a random model. Missing mouse or human PR-curves are due to missing benchmark data for the corresponding pathway.
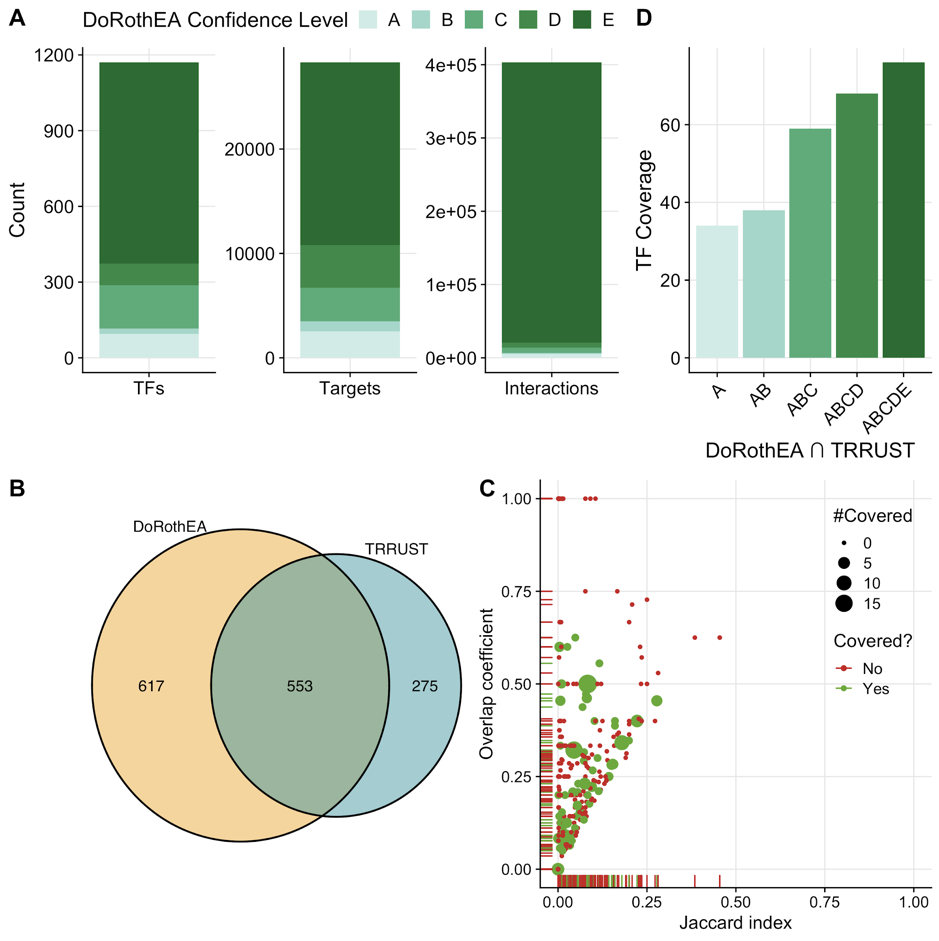
Figure A.4: (A) Mouse-DoRothEA properties showing number of transcription factors (TF), targets, and interactions itemized by confidence level. (B) Overlap of TFs between mouse-DoRothEA and TRRUST. (C) Similarity analysis of target genes for each overlapping TF between mouse-DoRothEA and TRRUST. Jaccard index and overlap coefficient were used to quantify similarity. Color and size indicate if and how often the TF was covered in the benchmark data. (D) Number of TFs covered in the benchmark dataset by intersection of mouse-DoRothEA and TRRUST dependent of the TF-confidence level.
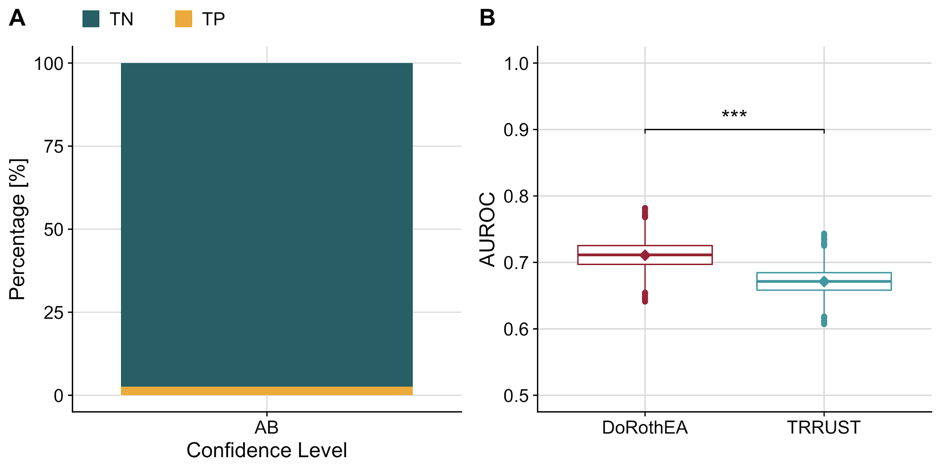
Figure A.5: (A) Barplot showing the imbalance of true negatives (TN) and true positives (TP) in our benchmark dataset for mouse-DoRothEA filtered for confidence level A or B. (B) Distribution of AUROC’s computed for DoRothEA and TRRUST separately from a balanced dataset (generated by downsampling the TN to equal the number of TP). The diamonds indicate the AUROC of the unbalanced dataset.