Chapter 4 Transcriptomic cross-species analysis of chronic liver disease reveals consistent regulation between humans and mice
4.1 Preface
The text of the following chapter is based on an early draft of the later published manuscript “Transcriptomic cross-species analysis of chronic liver disease reveals consistent regulation between humans and mice” (Christian H. Holland et al., 2021) that was originally written by myself. Unless otherwise stated I performed all bioinformatics-related analyses myself.
4.2 Background
In recent decades the number of patients suffering from chronic liver disease (CLD) has increased (Younossi et al., 2020). To study the development and progression of CLD, with the ultimate aim to identify therapeutic targets and test drug candidates mouse models are often used. However, their use for translational research has been discussed controversially due to known large interspecific differences (Leist & Hartung, 2013). An earlier comparison of gene expression in mouse models of non-alcoholic fatty liver disease (NAFLD) and human liver tissue reported large interspecies differences, with very little overlap in expression changes in mice and humans (Teufel et al., 2016). This finding questions whether experiments in mice allow conclusions about the pathophysiology of CLD in humans. To shed light on this question I revisited the changes in gene expression in liver disease mouse models and compared them to patient cohorts of CLD.
Previous comparisons between mice and humans were limited by exposure of mice to harmful substances and typically relied on exposure periods of only a few months or even weeks (Campos et al., 2020; Teufel et al., 2016). This may seem appropriate because a 1-year-old mouse is comparable to a 40-year-old, extrapolated from the relative lifespans of humans and mice. However, it remains to be seen whether such assumptions is justified, i.e., whether the disease progresses faster in mice, or whether comparable time frames of damage are necessary to obtain similar phenotypes. To answer this question, I analyzed gene expression data from a mouse model that was treated with CCl4 for up to a year and compared it to a collection of human CLD expression data. Furthermore, I characterized changes in gene expression in mice with either chronic or acute liver injury. This was justified by a recent study that suggested that the expression changes observed in mouse models of chronic and acute damage are similar to those observed in human CLD (Campos et al., 2020). The liver of mice responded to acute injuries by simultaneously upregulating inflammation- and downregulating metabolism-associated gene regulatory networks, both controlled by a common upstream master regulator. Chronic mouse models and even patients with CLD responded similarly (Campos et al., 2020). To define the therapeutic window, it may be important to distinguish between genes altered exclusively in chronic insult and genes altered during both chronic and acute injury. If a gene that is altered exclusively in chronic damage and is relevant to the progression of the disease, it is recommended to focus therapeutically on advanced stages when its expression increases; in contrast, genes altered under both chronic and acute conditions may be inhaled earlier in the course of the disease.
In the present study, bioinformatics analysis confirmed the previously reported large interspecies differences, but also revealed substantial sets of genes that respond similarly in both species. Interestingly, the categories of genes that were exclusively altered after acute or chronic injury compared to those conserved in both damage scenarios differed in their similarity to human CLD. Genes conserved in both the acute and chronic settings showed higher similarity to the human situation, and importantly, the similarity to human CLD increased when mice were exposed for longer periods of up to one year. These findings were compiled into a data resource linking expression profile alterations of individual genes in CLD, their differential regulation in mice and humans, and categorization into acute, chronic, or conserved response sets. This resource is accessible via an online application to facilitate the intuitive exploration of the role of genes in human and mouse CLD.
4.3 Materials and Methods
A detailed description is available in Supplementary Material and Methods (Section C.1).
4.3.1 Mouse models and human datasets
The present analysis included genome-wide transcriptome data from seven mouse models (one with chronic and six with acute liver damage) comprising 227 mice (Table 4.1; Supplementary Figure C.1A) and five studies of human CLD with a total of 372 patients (Table 4.1; Supplementary Figure C.1B). The analyzed datasets were either generated by the group of Jan Hengstler (all mouse models except tunicamycin) or downloaded from public sources (acute tunicamycin model and all human datasets). Additionally, I analyzed nine published sets of differentially expressed genes of CLD mouse models, for which the corresponding raw data was not available (Teufel et al., 2016).
For the mouse models generated by the group of Jan Hengstler, a detailed description of treatment protocols, collection and processing of liver tissue, histopathology, RNA isolation, RNA-sequencing, or Affymetrix gene array analysis, and immunostaining were provided by them and is given in the supplement. In brief, for induction of chronic liver injury, 8-10 weeks-old male C57BL/6N mice were injected with CCl4 (1 g/kg b.w.; i.p. in olive oil) twice a week for 2, 6, and 12 months (Ghallab, Myllys, et al., 2019). For acute APAP intoxication, the mice received a single dose of 300 mg/kg i.p. in warm PBS (Ghallab, Myllys, et al., 2019). For acute intoxication with CCl4, a single dose (1.6 g/kg, i.p.) was administered (Ghallab, Myllys, et al., 2019). For acute intoxication with LPS, a single dose of 750 µg/kg was intraperitoneally injected (Godoy et al., 2016). Partial hepatectomy (PH) and bile duct ligation (BDL) were performed as previously published (Ghallab, Hofmann, et al., 2019; Mitchell & Willenbring, 2008).
Biopsies from patients with primary sclerosing cholangitis (PSC) and alcoholic liver disease were used for validation by immunostaining performed by Ahmed Ghallab.
| Organism | Damage | Treatment | N | Accession ID | Reference |
|---|---|---|---|---|---|
| Mouse | Chronic | CCl4 (Up to 12 months) | 36 | GSE167216 | Ghallab, Myllys, et al. (2019) and present study |
| Mouse | Acute | APAP (Up to 16 days) | 49 | GSE167032 | Present study |
| Mouse | Acute | CCl4 (Up to 16 days) | 46 | GSE167033 | Campos et al. (2020) and present study |
| Mouse | Acute | PH (Up to 3 months) | 52 | GSE167034 | Present study |
| Mouse | Acute | BDL (Up to 3 weeks) | 29 | GSE166867 | Ghallab, Hofmann, et al. (2019) and present study |
| Mouse | Acute | LPS (24 hours) | 8 | GSE166488 | Godoy et al. (2016) |
| Mouse | Acute | Tunicamycin (6 hours) | 7 | GSE29929 | Teske et al. (2011) |
| Human | Chronic | Mild vs advanced NAFLD | 72 | GSE49541 | Moylan et al. (2014) |
| Human | Chronic | Full-spectrum of NAFLD | 78 | GSE130970 | Hoang et al. (2019) |
| Human | Chronic | NAFLD and NASH | 46 | GSE48452 | Ahrens et al. (2013) |
| Human | Chronic | NASH, NAFLD, PBC and PSC | 109 | GSE61260 | Horvath et al. (2014) |
| Human | Chronic | HCV and NAFLD | 67 | E-MTAB-6863 | Ramnath et al. (2018) |
4.3.2 Processing and analysis of transcriptomic data
Raw data of publicly available transcriptome studies were downloaded from Gene Expression Omnibus or ArrayExpress. Microarray and RNA-sequencing data were processed and normalized with the R/Bioconductor packages oligo, limma, and edgeR. FASTQ files from the chronic CCl4 study were aligned using the web application Biojupies (Torre, Lachmann, & Ma’ayan, 2018). Differential gene expression analysis (DGEA) between two conditions was performed using the R/Bioconductor package limma. A gene was considered differentially expressed with a false discovery rate (FDR) \(\le\) 0.05 and an absolute log-fold change (logFC) \(\ge\) 1. The result of a DGEA is referred to as a (gene) signature.
4.3.3 Time-series clustering
Time-series gene expression data were clustered with the software program STEM (Short Time-series Expression Miner, version 1.3.1216; Ernst, Nau, & Bar-Joseph (2005); Ernst & Bar-Joseph (2006)) using logFC from the preceding DGEA.
4.3.4 Comparison of gene set similarity
The similarity or overlap between two gene sets was summarized either as Jaccard Index or Overlap Coefficient. Unless otherwise stated, the gene sets were composed of the top 500 differentially expressed genes based on limma’s moderated t-value.
4.3.5 Testing direction of regulation with Gene Set Enrichment Analysis
To test whether the differentially expressed genes of a specific study are consistently regulated in an independent study, Gene Set Enrichment Analysis (GSEA) was performed. The gene sets comprised the top 500 up- and downregulated genes extracted based on the moderated t-statistic. GSEA was performed with the R/Bioconductor package fgsea (version 1.14.0; Sergushichev (2016)).
4.3.6 Construction and ranking of exclusive chronic, exclusive acute, and common gene sets
First, the union of all differentially expressed genes (FDR \(\le\) 1e-4 and |logFC| \(\ge\) 1) was built across all the signatures derived from the chronic or acute mouse experiments. Subsequently, genes were classified as exclusively chronic, exclusively acute, or commonly regulated in chronic and acute. For each of these three different gene set classes, a custom metric was computed to rank genes within these sets, e.g. the metric for the exclusive chronic gene set prioritized genes that were deregulated in chronic but not in acute signatures. Similarly, the metric for exclusive acute genes highly ranked genes that were deregulated in acute but not in chronic signatures. Finally, the metric for the common genes ranked genes as ‘high’ that were altered in both chronic and acute signatures.
4.3.7 Functional characterization of transcriptomic data with various gene set resources
Transcriptomic data were functionally characterized using biological processes from Gene Ontology (GO), DoRothEA’s regulons (Garcia-Alonso et al., 2019; Christian H. Holland, Szalai, et al., 2020), and PROGENy’s pathway responsive-genes (Christian H. Holland, Szalai, et al., 2020; Schubert et al., 2018), applying overrepresentation analysis. The number of background genes was set to 20,000 and the minimal gene set size to 10.
4.3.8 Identification of consistently deregulated genes in patients and chronic CCl4 mouse model
To identify consistently deregulated genes in patients of CLD and the chronic CCl4 mouse model, the top 500 up- and downregulated genes, respectively, were extracted from each human signature. Subsequently, those gene sets were enriched in the signatures from the chronic CCl4 mouse model by using the R/Bioconductor package fgsea (version 1.14.0; Sergushichev (2016)) with 1000 permutations. Afterward, the leading-edge genes were extracted from each enrichment if they met two criteria: i) FDR \(\le\) 0.05, and ii) consistent regulation between human and mouse data. Leading-edge genes that appeared in at least three studies per chronic time point were considered consistently deregulated in humans and mice.
4.4 Results
4.4.1 Chronic liver damage in mice
Ahmed Ghallab performed a study of chronic liver damage in mice with twice-weekly administrations of the hepatotoxic compound CCl4 for up to twelve months. Six animals per group were analyzed by RNA-sequencing after two, six, and twelve months (Figure 4.1A). Histological analyses showed progressive fibrogenesis particularly between months 6 and 12 accompanied by increased transaminase enzyme activities in blood (Figure 4.1B and C). Principal component analysis (PCA) showed that mice from the individual treatment groups clustered together; chronic CCl4 intoxication led to a shift inversely along with principal component 1 (PC1), while the solvent oil caused a shift along PC2 (Supplementary Figure C.2A). The number of differentially expressed genes increased particularly between months six and twelve (Supplementary Figure C.2B and C). Overlap analysis of the differential genes showed that most genes deregulated at an earlier time were also altered later and additional differential genes occurred (Figure 4.1D). Among the genes in the overlap of all three exposure periods with the highest fold-changes are the extracellular matrix protein Col28a1, two sulfotransferase isoforms (Sult2a1 and 2a2), the basement membrane glycoprotein Tinag, the positive regulator of PP1 phosphatase Ppp1r42 that plays a role in centrosome separation (up); three members of the lipocalin family (Mup12, 15 and 19); the DBH-like monooxygenase protein 1, Moxd1 (down) (Figure 4.1E). Time-dependent clustering resulted in 7 clusters, four clusters with up-, two with down, and one with initially up and later downregulated genes (Figure 4.1F). Upregulated clusters were enriched in inflammation and proliferation-associated genes, with Lyl1 and Maf as the most overrepresented transcription factors and TNFa as well as NFkB as the most overrepresented pathways. The dominant GO terms of the downregulated clusters were all metabolism-associated with HNF1a and HNF4a as most significantly overrepresented TFs. The initially up- and later downregulated cluster contained mostly extracellular matrix-associated genes.
In summary, transcriptomics in agreement with histological analyses consistently supports progressive inflammation and fibrosis with a relatively mild phenotype until month 6 in contrast to massive progression between months 6 and 12.
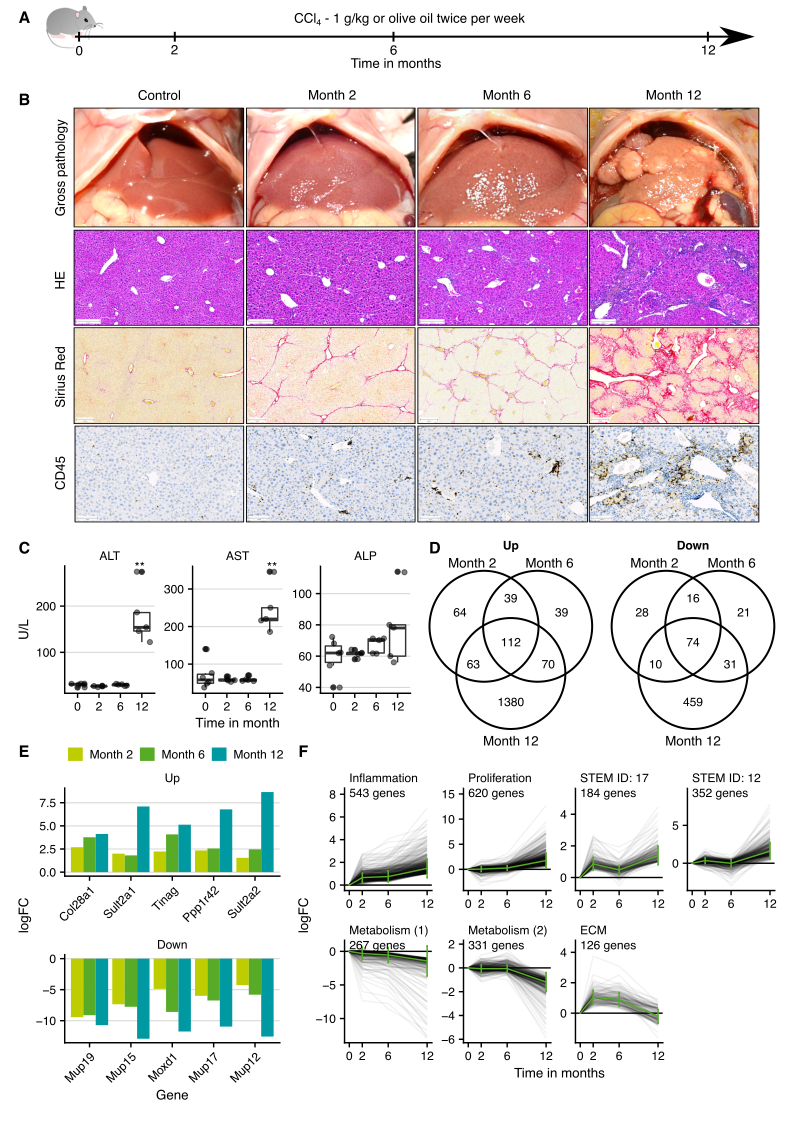
Figure 4.1: Gene expression changes in the CCl4 mouse model of CLD. A. Experimental design. Six mice were analyzed in each treatment group. B. Histological analyses with hematoxylin and eosin (HE) staining, visualization of fibrosis by Sirius red, and infiltration of immune cells by CD45; scale bars: 200 µm (HE; Sirius red) and 100 µm (CD45). C. Clinical chemistry of alanine transaminase (ALT), aspartate transaminase (AST) and alkaline phosphatase (ALP) activities in plasma. D. Overlaps of up- and downregulated genes. E. Genes in the overlap of the three exposure periods with the highest fold changes. F. Time-resolved clustering of deregulated genes with the dominant GO terms or the default profile names (STEM ID), if no significantly overrepresented GO term was obtained. The panels B and C were provided by Ahmed Ghallab.
4.4.2 Acute liver damage in mice
Next, Ahmed Ghallab and I studied time-resolved acute liver damage after single doses of CCl4 and APAP, as well as partial hepatectomy (PH), and common bile duct ligation (BDL), and single time points after lipopolysaccharide (LPS) and tunicamycin (Table 4.1). While I was responsible for the bioinformatics analysis Ahmed Ghallab performed imaging and chemistry analyses. As an example, the APAP model is presented in Figure 4.2, corresponding summaries of the other mouse are shown in Supplementary Figures C.4-C.9.
To induce acute liver injury the mice were treated once with a hepatotoxic but not lethal dose of 300 mg/kg body weight APAP and the transcriptome was profiled at 9 time points after injection spanning from 1 hour to 16 days (Figure 4.2A). Histological analyses showed pericentral necrotic tissue on day 1 with almost complete regeneration until day 8 without the formation of fibrosis (Figure 4.2B). Infiltration of CD45 positive immune cells was observed between days 1 and 4. Clinical chemistry showed a transient increase in liver enzymes (Figure 4.2C). Thus, the histological alterations correspond well to previous studies of APAP intoxication in mice (Sezgin et al., 2018). In the PCA space, differences to the controls were largest between 12 hours and day 2 and subsequently returned towards the control levels that is also reflected in the number of differentially expressed genes (Figure 4.2D and E; Supplementary Figure C.3A and B). The strongest upregulated genes were the chaperone Hspa1a (12 hours), Chil3, a protein secreted by macrophages that is involved in inflammatory processes (day 1), and calcium-binding protein S100a6 that is involved in the response to different types of cell stress (day 2). Among the most downregulated genes were numerous cytochrome P450 enzymes, including Cyp7a1, a key enzyme in bile acid synthesis, numerous further metabolic enzymes such as Acot1 that plays a role in fatty acid metabolism, and also Inhbe, a member of the TGF-beta superfamily (Figure 4.2F). Clustering of gene expression trajectories resulted in seven clusters, three with up-and four with downregulated genes (Figure 4.2G). Upregulated clusters were enriched in stress response, migration, and proliferation-associated genes with Atf3, Sp1, and E2F4 as enriched transcription factors and TGF-beta as the most enriched pathway. Genes of the downregulated clusters were predominantly metabolism-associated with HNF4a and Cebpa as significantly overrepresented TFs.
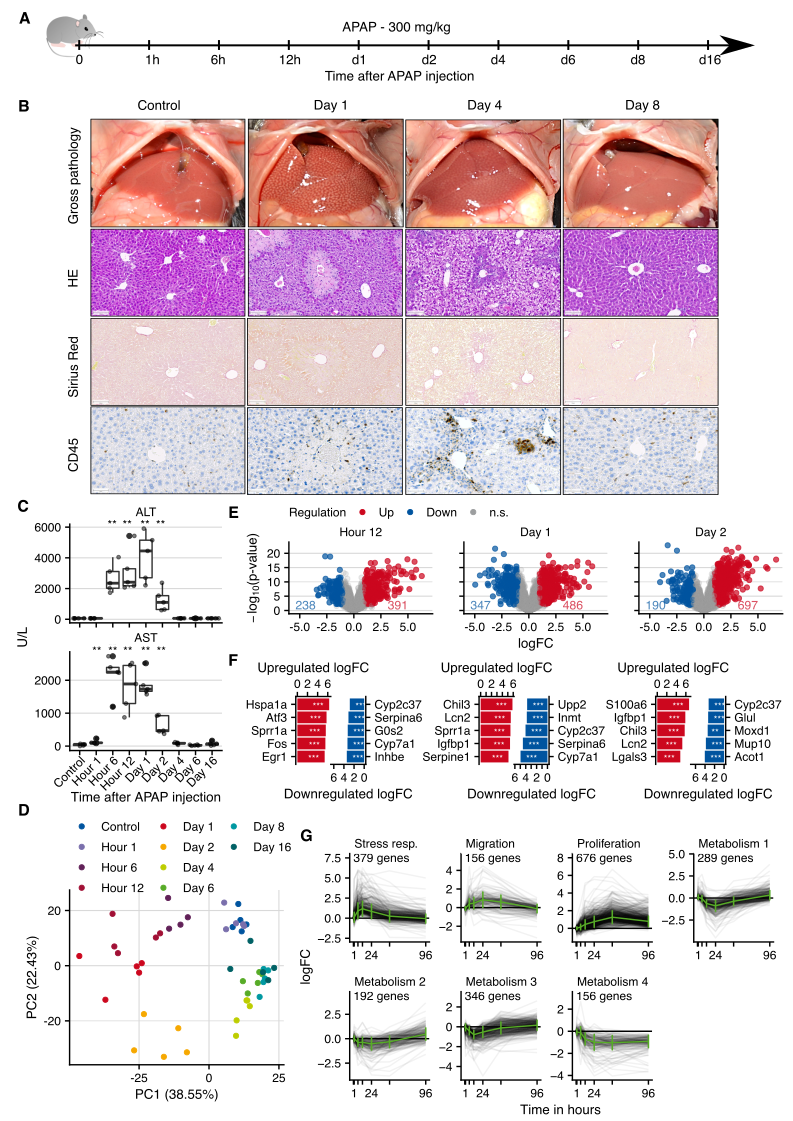
Figure 4.2: Gene expression changes in a mouse model of acute liver damage induced by administration of 300 mg/kg b.w. acetaminophen (APAP). A. Experimental design. Five mice were analyzed in each treatment group. B. Histological analyses with hematoxylin and eosin (HE) staining, lack of fibrosis visualized by Sirius red, and infiltration of immune cells by CD45 immunostaining; scale bars: 100 µm (HE; Sirius red) and 50 µm (CD45). C. Clinical chemistry of alanine transaminase (ALT) and aspartate transaminase (AST) activity in plasma. D. PCA analysis of global expression changes. E. Volcano plots of gene expression changes at 12 hours, days 1 and 2 after APAP administration. F. Genes with the highest logFCs. G. Time-resolved clustering of deregulated genes. The panels B and C were provided by Ahmed Ghallab.
A common feature of the studies with acute time series is that the maximal number of deregulated genes was reached at 24 or 48 hours after the intervention and returned completely or almost completely to control levels within 16 days. An exception was BDL, where expression changes persisted due to the irreversible obstruction of the bile duct. To investigate the consistency of the gene signature across the six acute mouse models I first set out to compare the similarity of the top 500 differentially expressed genes. For mouse models with several time points and a reversible phenotype, the time point with the strongest deregulated expression profile was used (Supplementary Figure C.10), while the 24 hour time point was selected for the BDL model.
Globally, I found a low gene overlap across the six models (mean Jaccard Index of 0.058; Figure 4.3A), with the highest similarity between APAP and CCl4 (Jaccard Index of 0.157) and the lowest between LPS and tunicamycin (Jaccard Index of 0.012). This pairwise comparison revealed that each treatment yields a distinctive set of top differentially expressed genes which at first glance could be interpreted as inconsistency across them. Next, I tested whether the direction of regulation of the top differentially expressed genes is conserved within the six acute mouse models. For this purpose, I performed a mutual enrichment of the top 500 up-and downregulated genes in the acute contrasts. This analysis revealed that the different sets of upregulated genes were coordinately upregulated in all other acute contrasts (Figure 4.3B). The same applied to the sets of downregulated genes. As the only outlier, the top 500 upregulated genes after LPS treatment tended to be enriched among the downregulated genes of the tunicamycin model (FDR=0.052). These systematic comparisons showed that although the top differentially expressed genes were distinct the direction of regulation was consistent.
4.4.3 Exclusively and commonly regulated genes of chronic and acute liver damage in mice
To identify a set of exclusive chronic, exclusive acute, and common acute and chronic genes, I integrated and analyzed all available acute and chronic time points. I constructed a pool of chronic and acute genes by taking the union of all differentially expressed genes from the chronic and acute mouse models. The unified genes of the acute and also chronic studies showed consistent up- or downregulation across the individual contrasts, respectively (Supplementary Figure C.11). Set comparisons between the pools of unified acute and chronic genes revealed 834 exclusive chronic, 2777 exclusive acute, and 586 common genes (Figure 4.3C). To identify the top 100 genes in each category, I developed a custom metric that ranks the genes based on their expression in the chronic and selected acute contrasts.
In the top 100 exclusive chronic genes, 97 genes were up-and only 3 genes were downregulated (Figure 4.3D). Subsequently, I functionally characterized all up and downregulated exclusive chronic genes, by overrepresentation analysis. As gene set resources I used DoRothEA’s transcription factor regulons (Garcia-Alonso et al., 2019; Christian H. Holland, Szalai, et al., 2020), PROGENy’s pathway footprints (Christian H. Holland, Szalai, et al., 2020; Schubert et al., 2018), and GO-terms of biological processes. I found the target genes from the transcription factors Hif1a and Klf as well as the footprint genes from the TGF-beta pathway overrepresented in the set of upregulated exclusive chronic genes (Figure 4.3E and F). Text analysis of overrepresented GO terms revealed that most processes were associated with development and morphogenesis (Figure 4.3G). By manual classification I found 38 GO terms related to “Development and Morphogenesis” and 24 GO terms related to “Migration”, while the latter was more pronounced among the most significantly overrepresented GO terms. Functional characterization of the downregulated exclusive chronic genes highlighted the TFs Stat3, Sox2, and Hoxb13. Pathways as well as GO-terms, however, did not result in any significant associations.
For the exclusive acute gene set, I also extracted the top 100 exclusive acute genes (Supplementary Figure C.12A). The upregulated genes were associated with the TFs Myc, Trp53, and the pathways MAPK, EGFR, and TNFa (Supplementary Figure C.12B and C). GO terms were dominated by metabolic processes, however, I also identified a cluster of endoplasmic reticulum stress-related processes among the most significant GO-terms (Supplementary Figure C.12D). Downregulated genes were associated with the TFs Hnf4a, Ubtf, and Zpf263 and the pathway Androgen, Estrogen, EGFR, and MAPK (Supplementary Figure C.12E and F). GO terms were also almost exclusively related to metabolic processes (Supplementary Figure C.12G).
Out of the top 100 common genes, 53 were consistently up- and 47 downregulated (Figure 4.3H). Within this set, genes with inverse regulation in acute and chronic scenarios were extremely rare. Functional analysis of the upregulated genes identified the TF Klf5 and the pathways NFKb and TNFa as relevant (Figure 4.3I and J). Among the overrepresented GO terms, the term cell-cycle had the highest frequency (Figure 4.3K). In agreement, I identified a cluster of 37 GO terms that corresponds to the biological process of proliferation and represents the most significant GO terms. Downregulated genes were associated with the TFs Hnf4a and Nr4a1 (Supplementary Figure C.13A) and biological processes were dominated by metabolic and catabolic related GO-terms (Supplementary Figure C.13B). Thus, the integration of chronic and acute mouse data unveiled genes that are deregulated in both damage models and can be differentiated from gene sets exclusively deregulated in acute or chronic liver damage.
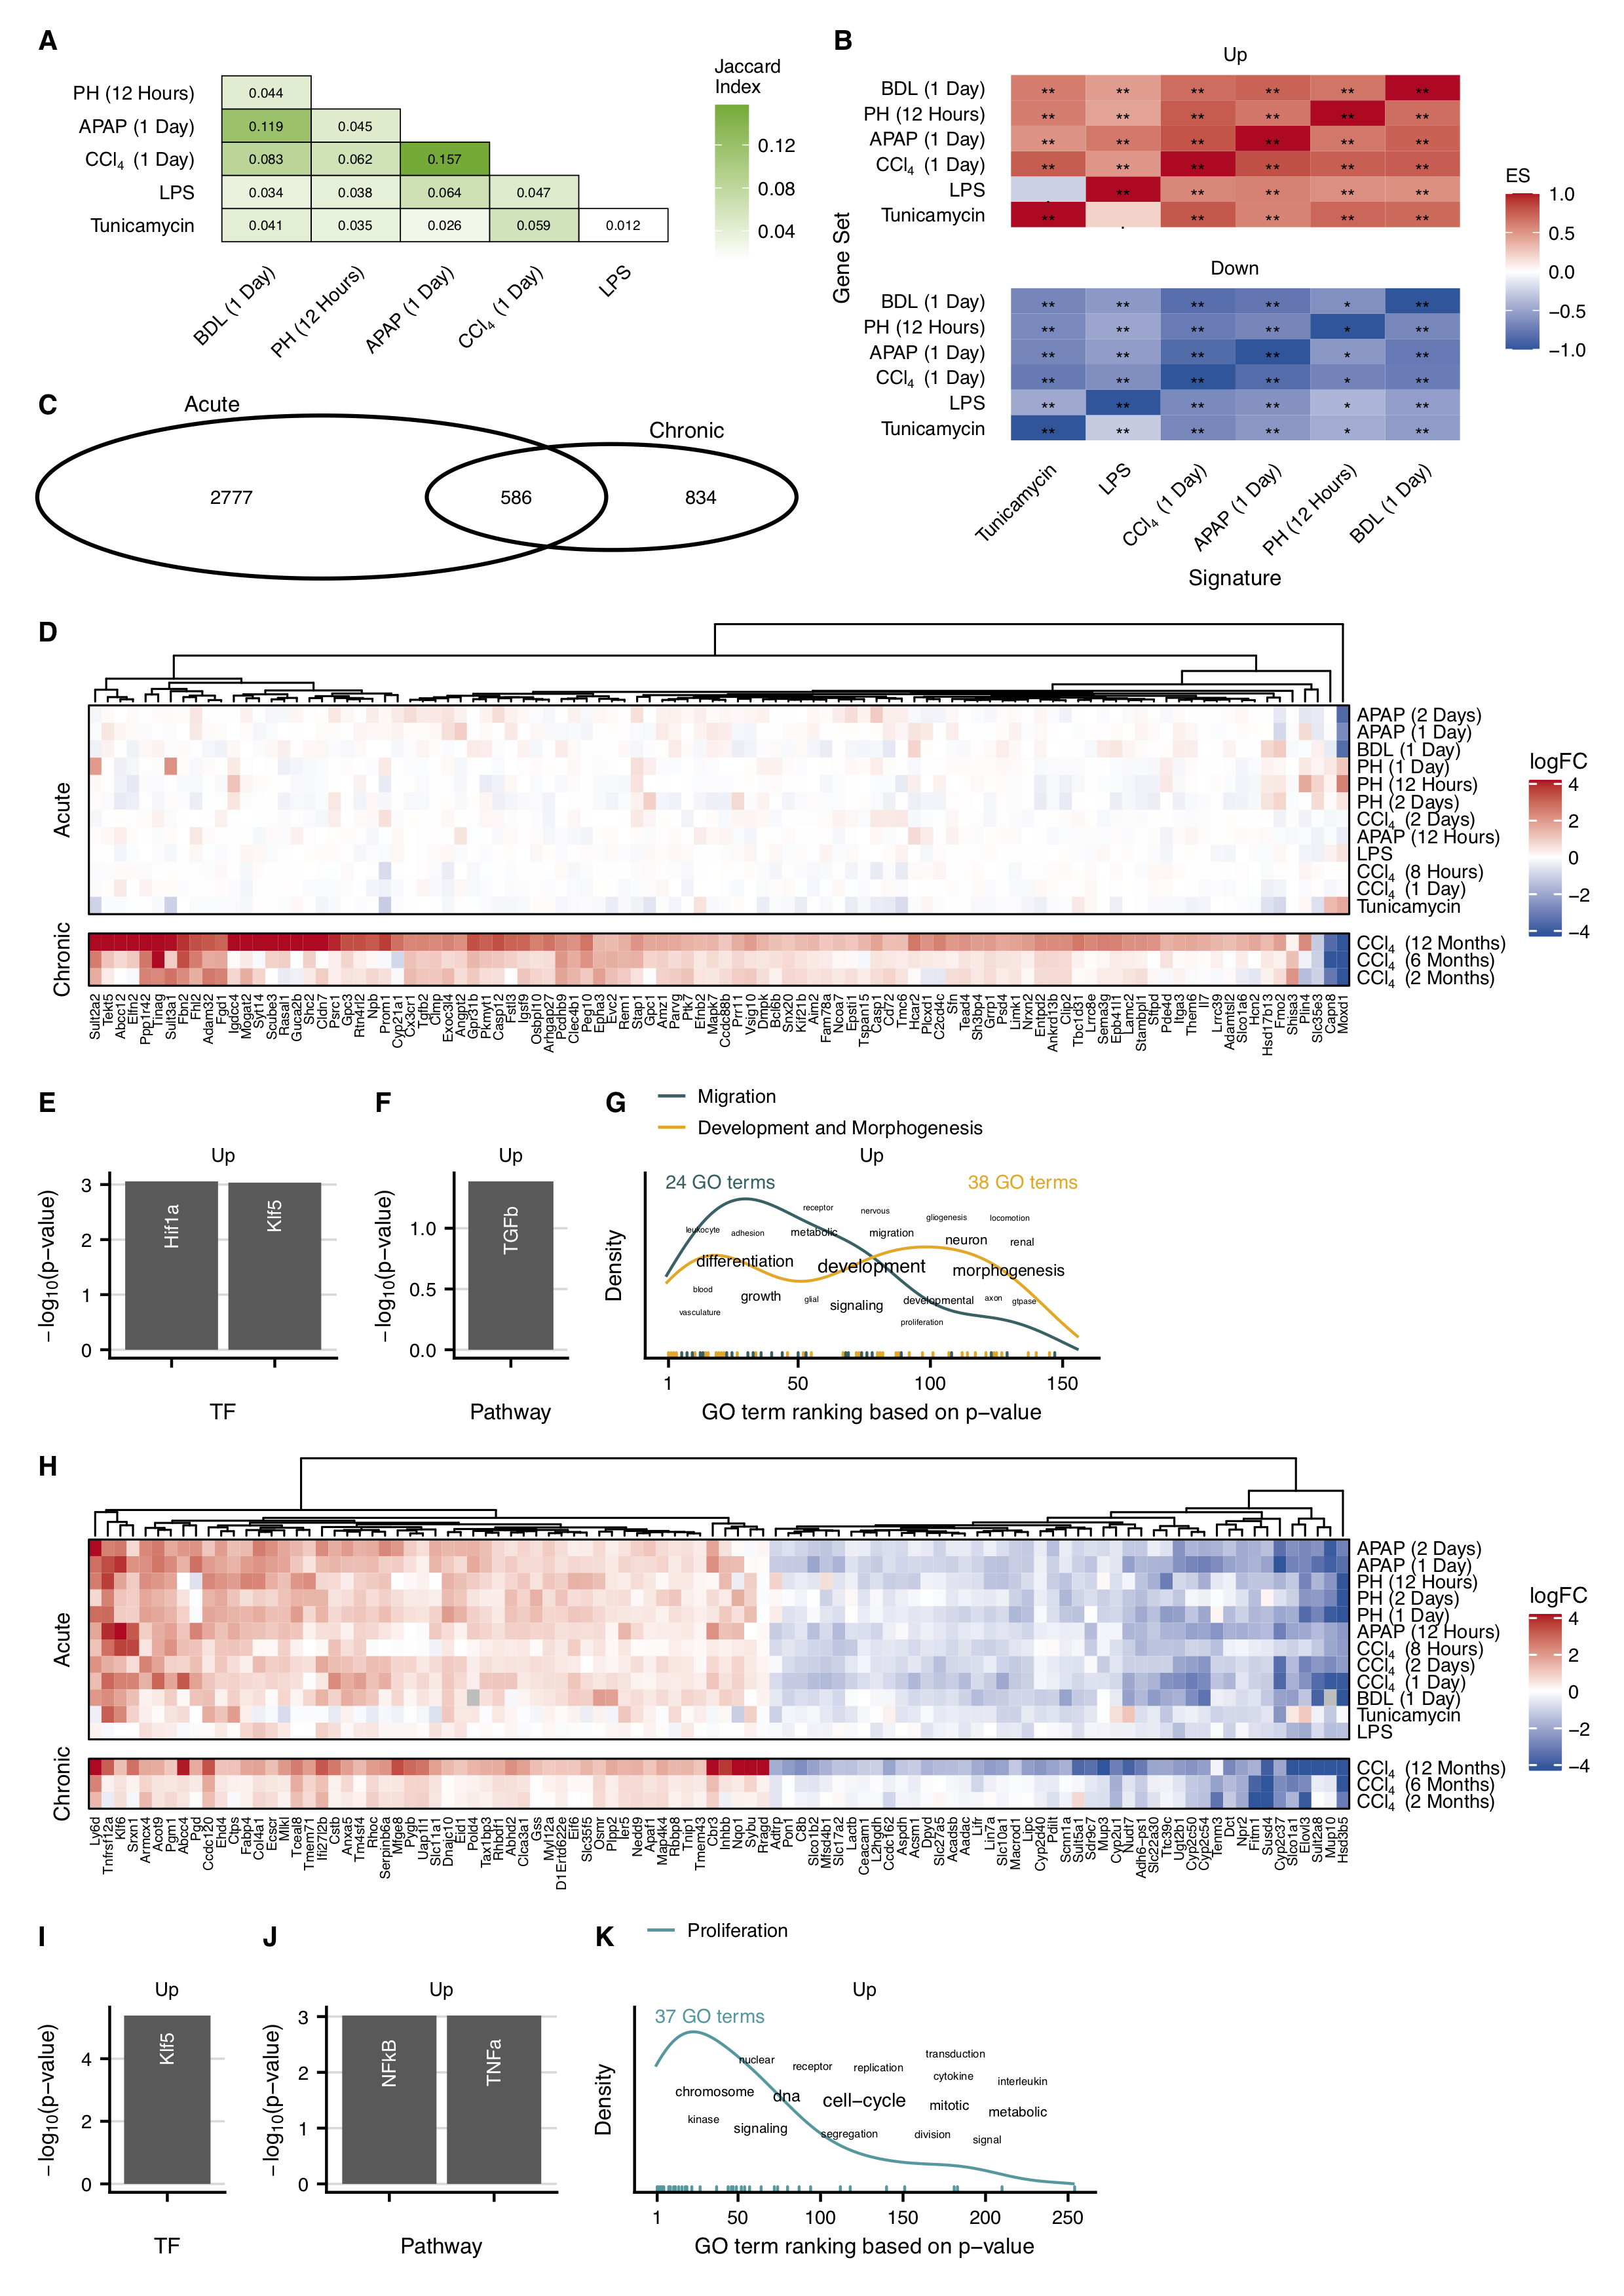
Figure 4.3: Comparison of gene expression changes in acute and chronic mouse models. A. Analysis of the similarity of the acute data sets. As a measure of similarity, the Jaccard index was calculated at the indicated time periods after the acute challenge. B. Pairwise enrichment analysis of the top 500 up- and downregulated genes (ES: enrichment score). C. Overlap of the unified acute and chronic (2, 6, and 12 months CCl4) genes. D. Heatmap of genes exclusively deregulated in the chronic mouse model. E-G. Overrepresented transcription factors, identified by DoRothEA (E), pathways obtained by PROGENy (F), and GO terms (G) in the upregulated exclusive chronic genes. H. Heatmap of genes commonly deregulated in the chronic and acute mouse models. I-K. DoRothEA (I), PROGENy (J), and GO (K) overrepresentation of the genes upregulated in the acute and chronic mouse models.
4.4.4 Similarities between humans and mice
I performed a cross-species analysis to evaluate how well the altered gene expression in the chronic CCl4 mouse model reflects the transcriptomic changes in humans that suffer from CLD. For this purpose, I collected genome-wide gene expression data from 5 publicly available patient cohorts with a total of 372 patients and five etiologies (Table 4.1, Supplementary Figure C.1B). These studies allowed us to calculate a total of 15 contrasts due to different disease stages and phenotypes.
Similar to the acute mouse models I first analyzed inter-study consistency comparing the similarity of the top 500 differentially expressed genes from each signature. Differential genes obtained from studies of the same groups of authors showed a higher degree of similarity (Supplementary Figure C.14). The highest similarity of two independent contrasts was observed between NAFLD (Moylan et al., 2014) and HCV (Ramnath et al., 2018) (Jaccard Index of 0.154). In summary, the similarity of the top differentially expressed genes in humans appeared to be low. However, the mutual enrichment of the top 500 up-and downregulated genes demonstrated a very high consistency of the direction of regulation within contrasts of the same group of authors but also observed still relatively high accordance across the cohorts reported by different authors (Figure 4.4A). Partially, the direction of regulation of genes from the cohorts of patients with PSC, PBC, and NAFLD did not match well with the other contrasts. However, all other pairwise comparisons yielded convincing consistent results. Similar to the analysis of the mouse studies, this systematic comparison shows that similarities between different studies can better be identified by an enrichment analysis that considers the orientation (up, down) of expression changes than just focussing on the top differentially expressed genes.
Considering that previous studies reported only very low overlap between differentially expressed genes of humans and mice in CLD (Teufel et al., 2016) and the above-described limitations of this type of comparison I performed a cross-species enrichment analysis between the chronic CCl4 model and the set of human data. For this purpose, I enriched the top 500 up-and downregulated genes from each human contrast in the three signatures from the individual time points of the chronic CCl4 experiment in mice. I found a high degree of accordance where all human gene sets were significantly and consistently enriched at any time point of the chronic CCl4 mouse signatures except for the up- and-downregulated genes of the PBC contrast, the downregulated genes of NAFLD contrast, and the upregulated genes of the NAFLD contrast; instead, I found that even the top 500 upregulated genes of the PBC contrast were significantly enriched among the downregulated genes of the 6-month time point of the chronic CCl4 signature (Figure 4.4B).
Having shown that the expression profiles of the here established CCl4 mouse model and the patients contain similar features, I set out to identify the genes which are consistently deregulated in humans and mice. My strategy is based on the leading-edge genes of the above-conducted enrichment analyses. By default, the leading-edge is defined as the subset of the gene set that mainly accounts for the enrichment score. I extracted the leading-edge genes only from those enrichment analyses that led to significant and consistent results in terms of the direction of regulation. Subsequently, I kept only those leading-edge genes that were identified in at least three human studies per time point in the chronic mouse model. The remaining leading-edge genes were defined as consistently deregulated genes in humans and mice in at least a single time point of the chronic mouse model. Across all time points, I identified 126 consistently up- and 102 consistently downregulated genes, whereby 45 (up) and 23 (down) genes were shared among all three chronic time points (Figure 4.4C).
To study whether it is possible to map those genes to individual cell types of the liver I integrated single-cell RNA-sequencing (scRNA-seq) data with the existing bulk data. For this purpose, I re-analyzed a publicly available scRNA-seq dataset of cirrhotic patients and healthy controls annotated with different cell types. Differentially expressed genes between cirrhotic and healthy patients were identified for each cell type individually (FDR \(\le\) 0.05 & |logFC| \(\ge\) 0.25). The resulting cell-type associated sets of differential genes overlapped with 50 of the above described 228 genes that are consistently regulated in humans and mice; 41 of the 50 genes were exclusive for a single cell type. From the total 228 consistently deregulated genes I identified the top 100 genes with respect to the highest average logFC across all human and mouse bulk contrasts (Figure 4.4D). Of those 100 genes, 79 were up-and 21 were downregulated and 31 were mapped to a specific cell type. Overall, the direction of regulation was consistent between bulk and scRNA-seq data. Finally, a functional characterization was performed separately for all up-and downregulated genes. The upregulated genes were significantly associated with the pathways TGFb and TFNa and the TFs SP1, RELA, and NFkB1 (Figure 4.4E and F). Biological processes related to migration and development-and-morphogenesis functionally characterize the upregulated genes. The downregulated genes were dominated by metabolic processes including the pathway Androgen (Supplementary Figure C.15A and B). Remarkably, I found that the upregulated genes mapped frequently to cholangiocytes, endothelial as well as mesenchymal cells and macrophages, and downregulated genes to hepatocytes. Mapping the consistently deregulated genes back to the 12-month signature which contains all altered genes of the chronic CCl4 mouse model revealed that the log-fold changes for upregulated genes are generally higher compared to the downregulated genes (Figure 4.4H). Genes consistently regulated between humans and mice did not show particularly low p-values or high fold-changes compared to all deregulated genes upon CCl4 treatment. In summary, my cross-species enrichment analysis identified a set of 228 genes that are consistently deregulated in humans and mice during CLD.
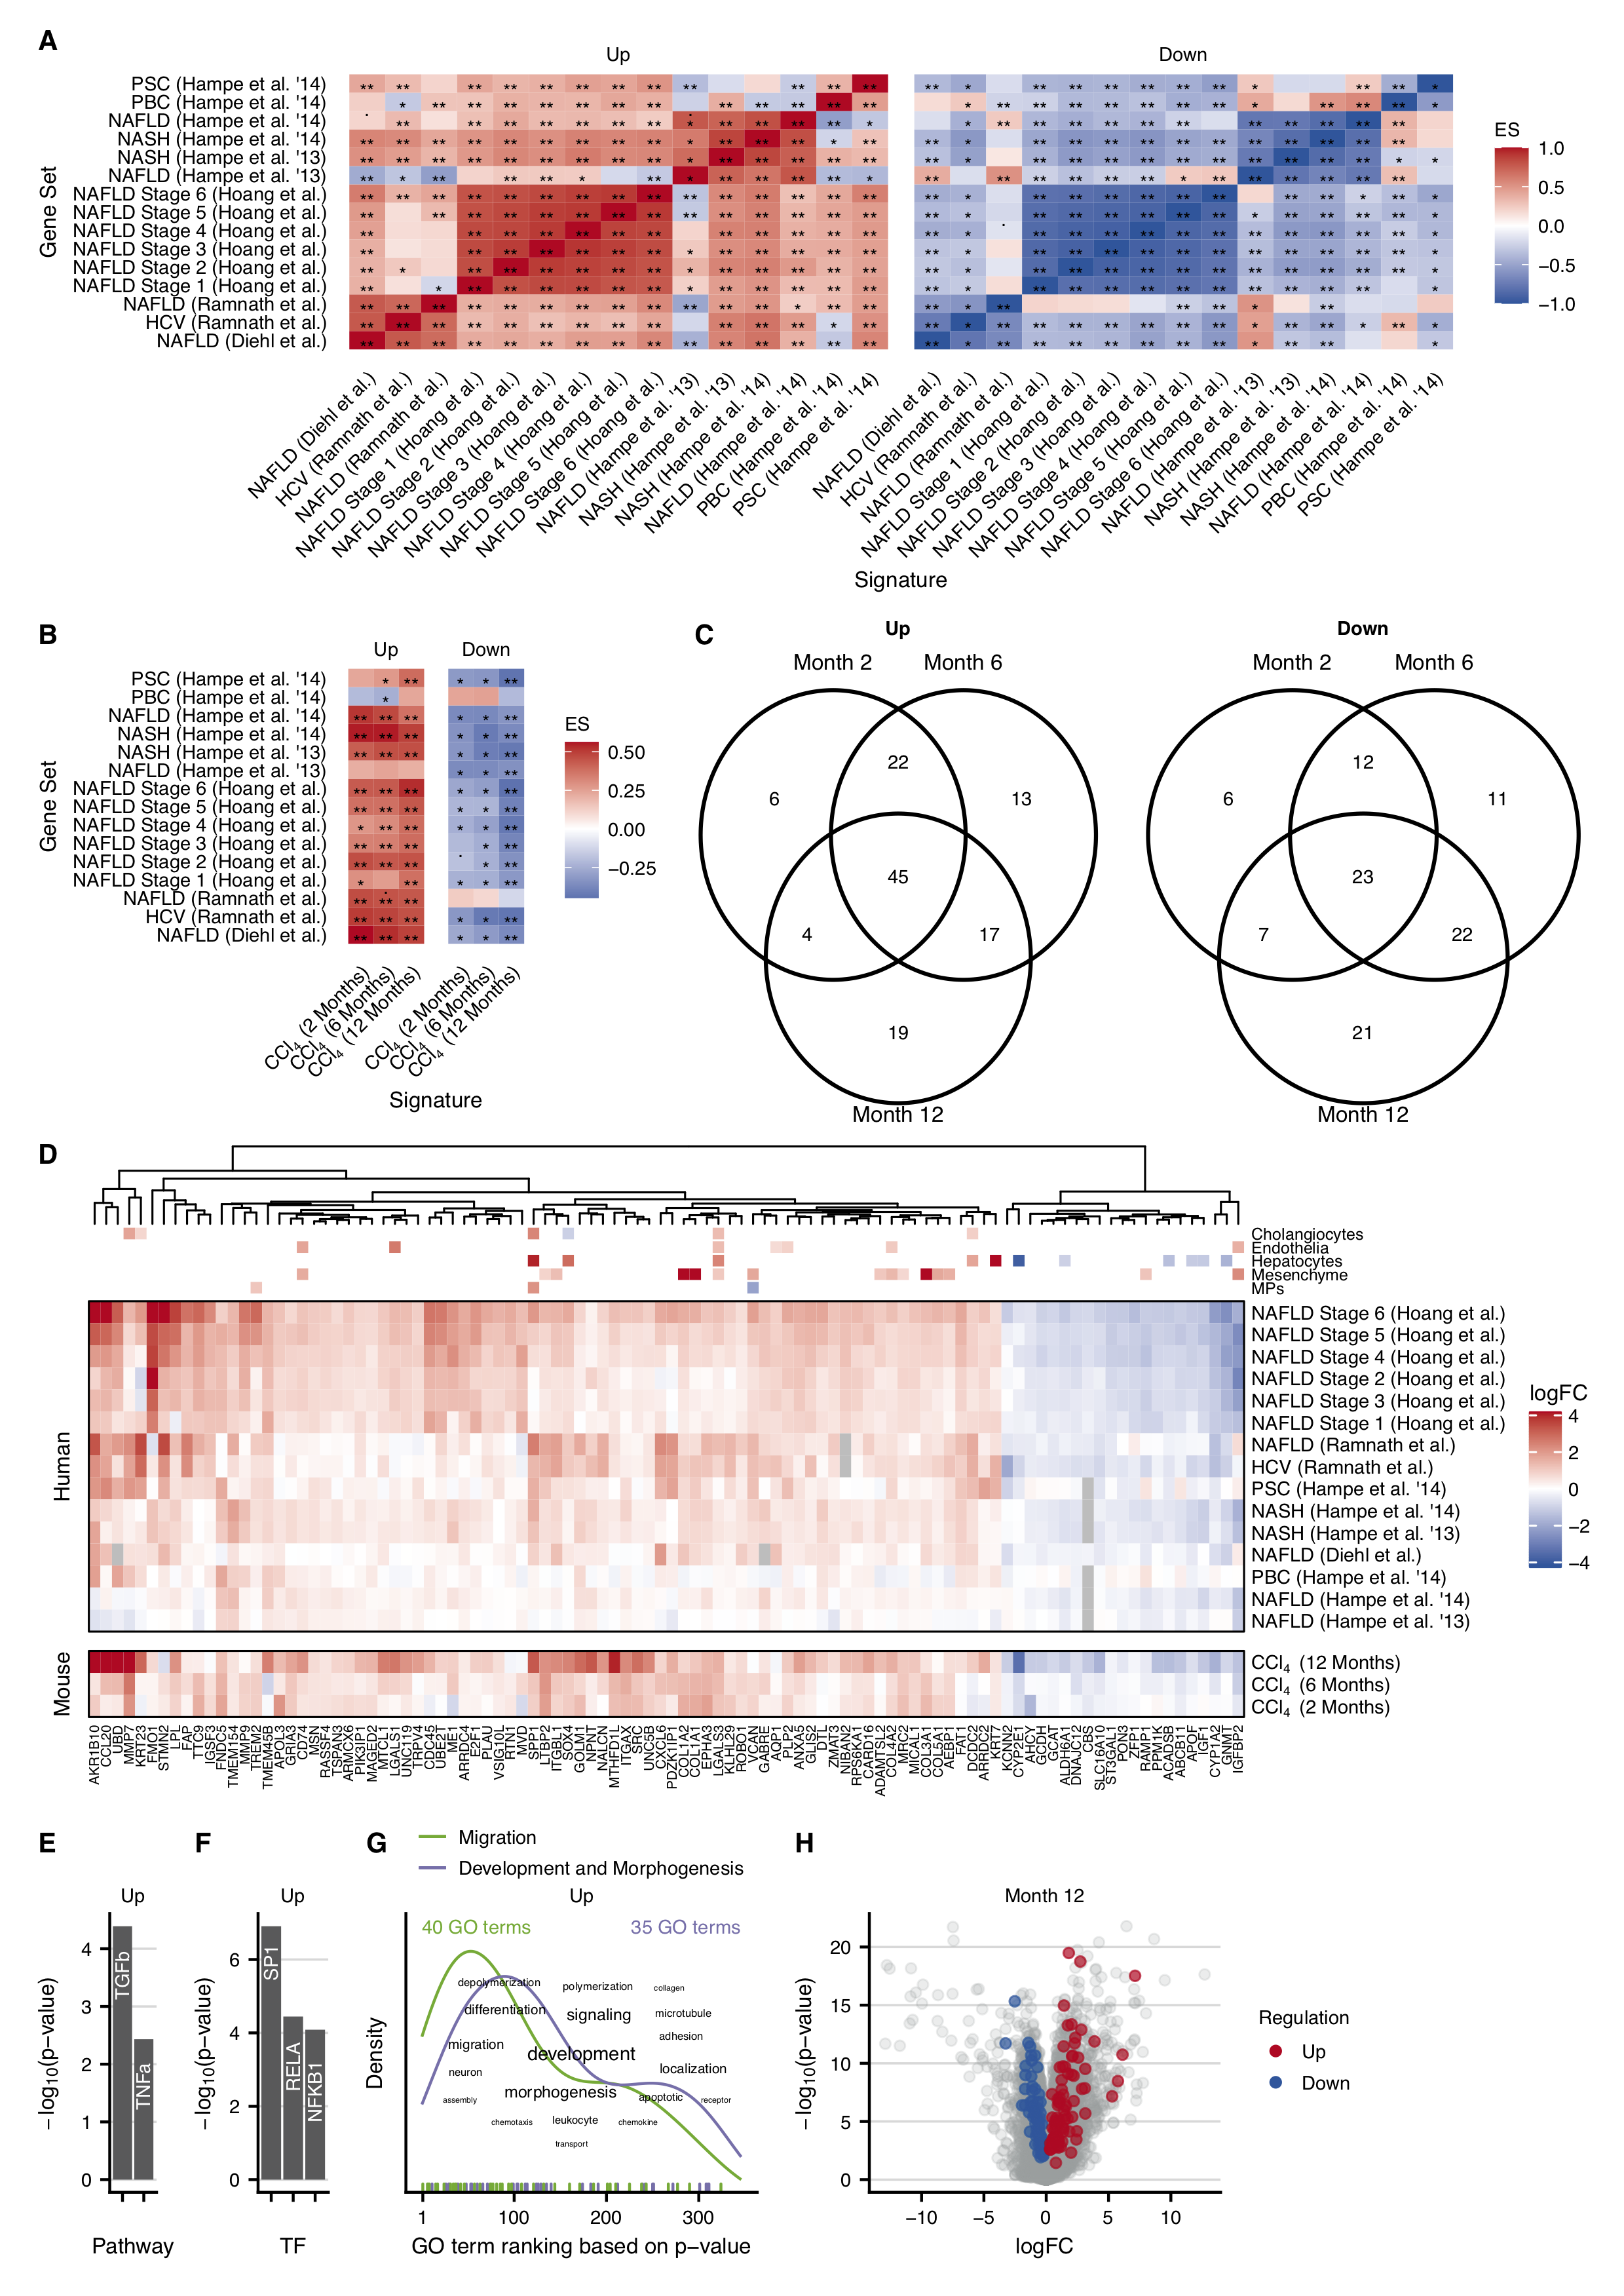
Figure 4.4: Human studies of liver disease and their similarities to the chronic CCl4 mouse model. A. Pairwise enrichment analysis of the top 500 up- or downregulated genes of the human studies (ES: enrichment score). B. Similarity between the human studies and the chronic CCl4 mouse model by pairwise enrichment analysis of the 500 top up- and downregulated genes. C. Overlaps of up- and downregulated genes in the chronic mouse model after 2, 6, and 12 months of CCl4 administration that are consistently regulated in the human studies. D. Heatmap of the top 100 genes consistently regulated in the human studies and in the chronic CCl4 mouse model. E-G. Characterization of the consistently deregulated genes in humans and mice by analysis of enriched pathways (E), transcription factors (F) and GO terms (G). H. Volcano plot of genes consistently deregulated in mouse and man (red and blue symbols) projected onto all genes deregulated in the chronic mouse model with CCl4 (grey symbols).
The consistent regulation in humans and mice, as well as the cell type specificity of gene expression, was confirmed at the protein level, using commercially available antibodies against three of the consistently upregulated genes, LTBP2, ANXA5, and AKR1B10. A strong increase in the extracellular matrix protein LTBP2 occurred after 12 months of CCl4 treatment in mice, and was expressed in the fibrotic tissue but not in the hepatocytes (Figure 4.5A). For analysis of the human situation, my collaborators Ahmed Ghallab and Jan Hengstler used independent biopsies of PSC patients. Since CCl4 induces pericentral necrosis in mice and a similar zonation is known for alcohol-related liver disease (ARLD), they additionally tested biopsies of ARLD patients. Similar to mice, LTBP2 was expressed in the fibrotic streets of PSC (Figure 4.5B) and ALRD (Figure 4.5C) patients and the staining intensity increased with the fibrosis stage. Expression in fibrotic tissue also confirmed the results of the scRNA-seq analysis that identified a mesenchymal cell type preference of LTBP2. Immunostaining of the aldo-keto reductase AKR1B10 and of annexin V (ANXA5) also showed similar upregulation in mouse and human CLD (Supplementary Figure C.16).
Next, I placed the deregulated genes identified in the present chronic CCl4 study into the context of previously published chronic mouse models and compared them to human CLD. The 12-month chronic CCl4 model resulted in a much higher number of differentially expressed genes than all other previously published mouse models (2721 up- and 1437 downregulated genes; FDR \(\le\) 0.05 & |logFC| \(\ge\) \(log_2\)(1.5); Supplementary Figure C.17A). In contrast, a model of the 18-week high-fat diet feeding yielded only 16 up and 19 downregulated genes, when applying the same cutoffs (Teufel et al., 2016). Similarity analysis of the differentially expressed genes between the chronic mouse models and the patient cohorts showed that the 12-month time point of the chronic CCl4 model was more similar to human data than all other models (mean overlap coefficient of 0.37; Supplementary Figure C.17B). However, this analysis is biased towards the total number of differentially expressed genes. To study how well mouse models reflect expression changes in human CLD independently from the total number of differentially expressed genes, I first pooled the differentially expressed genes of the same human etiology (NAFLD, NASH, HCV, PSC, PBC) to a unified set of altered genes. NAFLD and HCV showed higher numbers of differential genes than NASH, PSC, and PBC. The majority of differentially expressed genes occurred in a single disease (84.9%), and 12.2, 2.4, 0.5% were altered in 2, 3, or 4 of the 5 investigated diseases, respectively (Figure 4.6A). No single gene was differentially expressed in all etiologies.
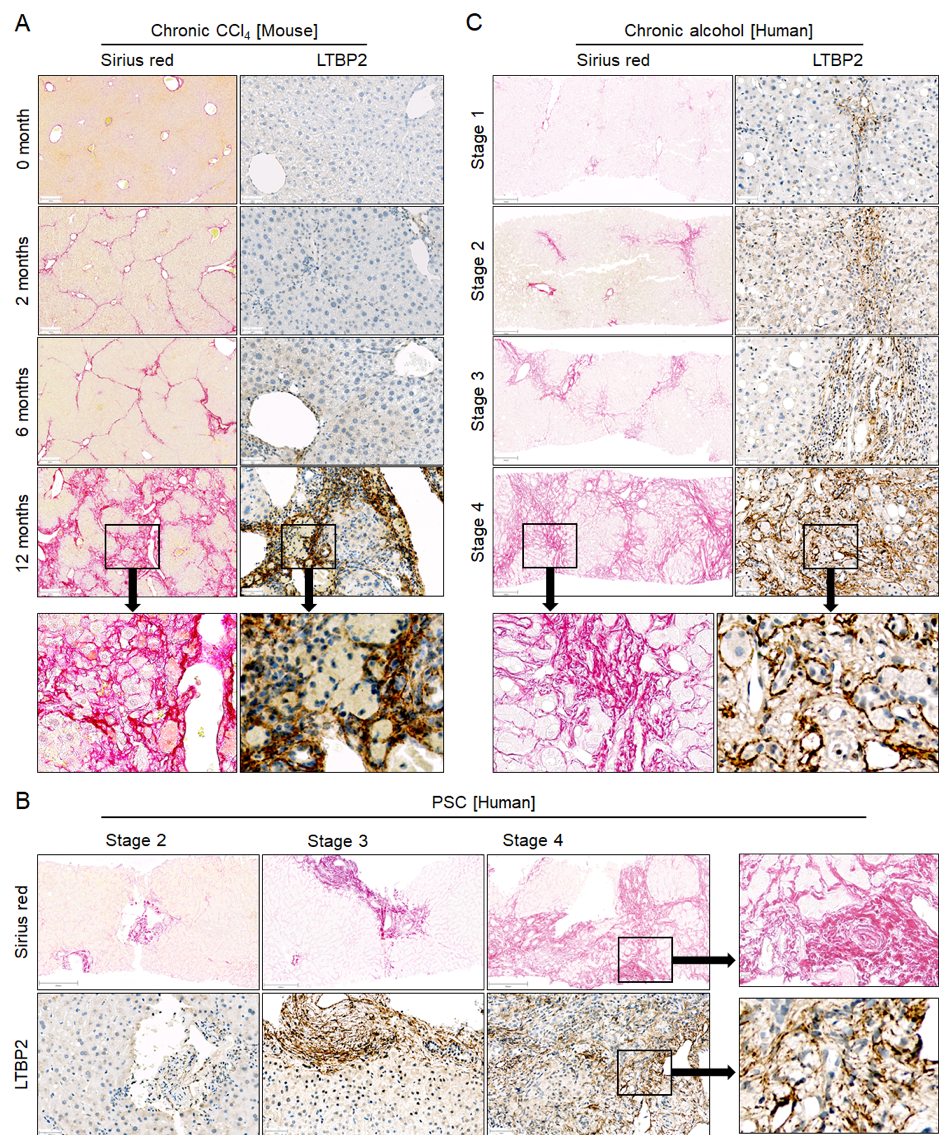
Figure 4.5: The extracellular matrix protein LTBP2 increases in CLD of mice and humans. A. Liver tissue of mice at different time periods after CCl4 treatment. B. Liver tissue of patients with different stages of PSC. C. Liver tissue of patients with ARLD of different stages. Stainings were performed with Sirius red (scale bars 200 µm) to visualize fibrosis and with antibodies against LTBP2 (scale bars 200 µm) in liver tissue of the same patients. The entire figure was provided by Ahmed Ghallab.
To quantify the similarity between the individual chronic mouse models and the different human disease-specific gene sets, I computed precision and recall metrics. Recall denotes the ratio of altered human genes that are also altered in mice with respect to all altered human genes. Precision denotes the ratio of genes altered in mice that are also altered in humans with respect to all altered mouse genes. In general, precision and recall of the chronic mouse models for the different human disease etiologies were highly variable (Figure 4.6B). Precision and recall pairs were highest for NAFLD and lowest for PBC. The 12-month chronic CCl4 model showed the highest recall among all etiologies. Moreover, recall of 12-months CCl4 was always higher than that of the 6 or 2 months damage periods. The western-type diet model had the highest precision related to the upregulated genes of NAFLD.
Finally, I revisited the exclusively and commonly regulated genes of chronic and acute mouse models (Figure 4.3) to study their similarity to human CLD (Figure 4.6C). As expected, exclusive acute mouse genes showed the lowest recall and precision with respect to CLD. Remarkably, common genes (deregulated in acute and chronic mouse models) resulted in higher metrics than the exclusive chronic genes for several comparisons, particularly with respect to NAFLD.
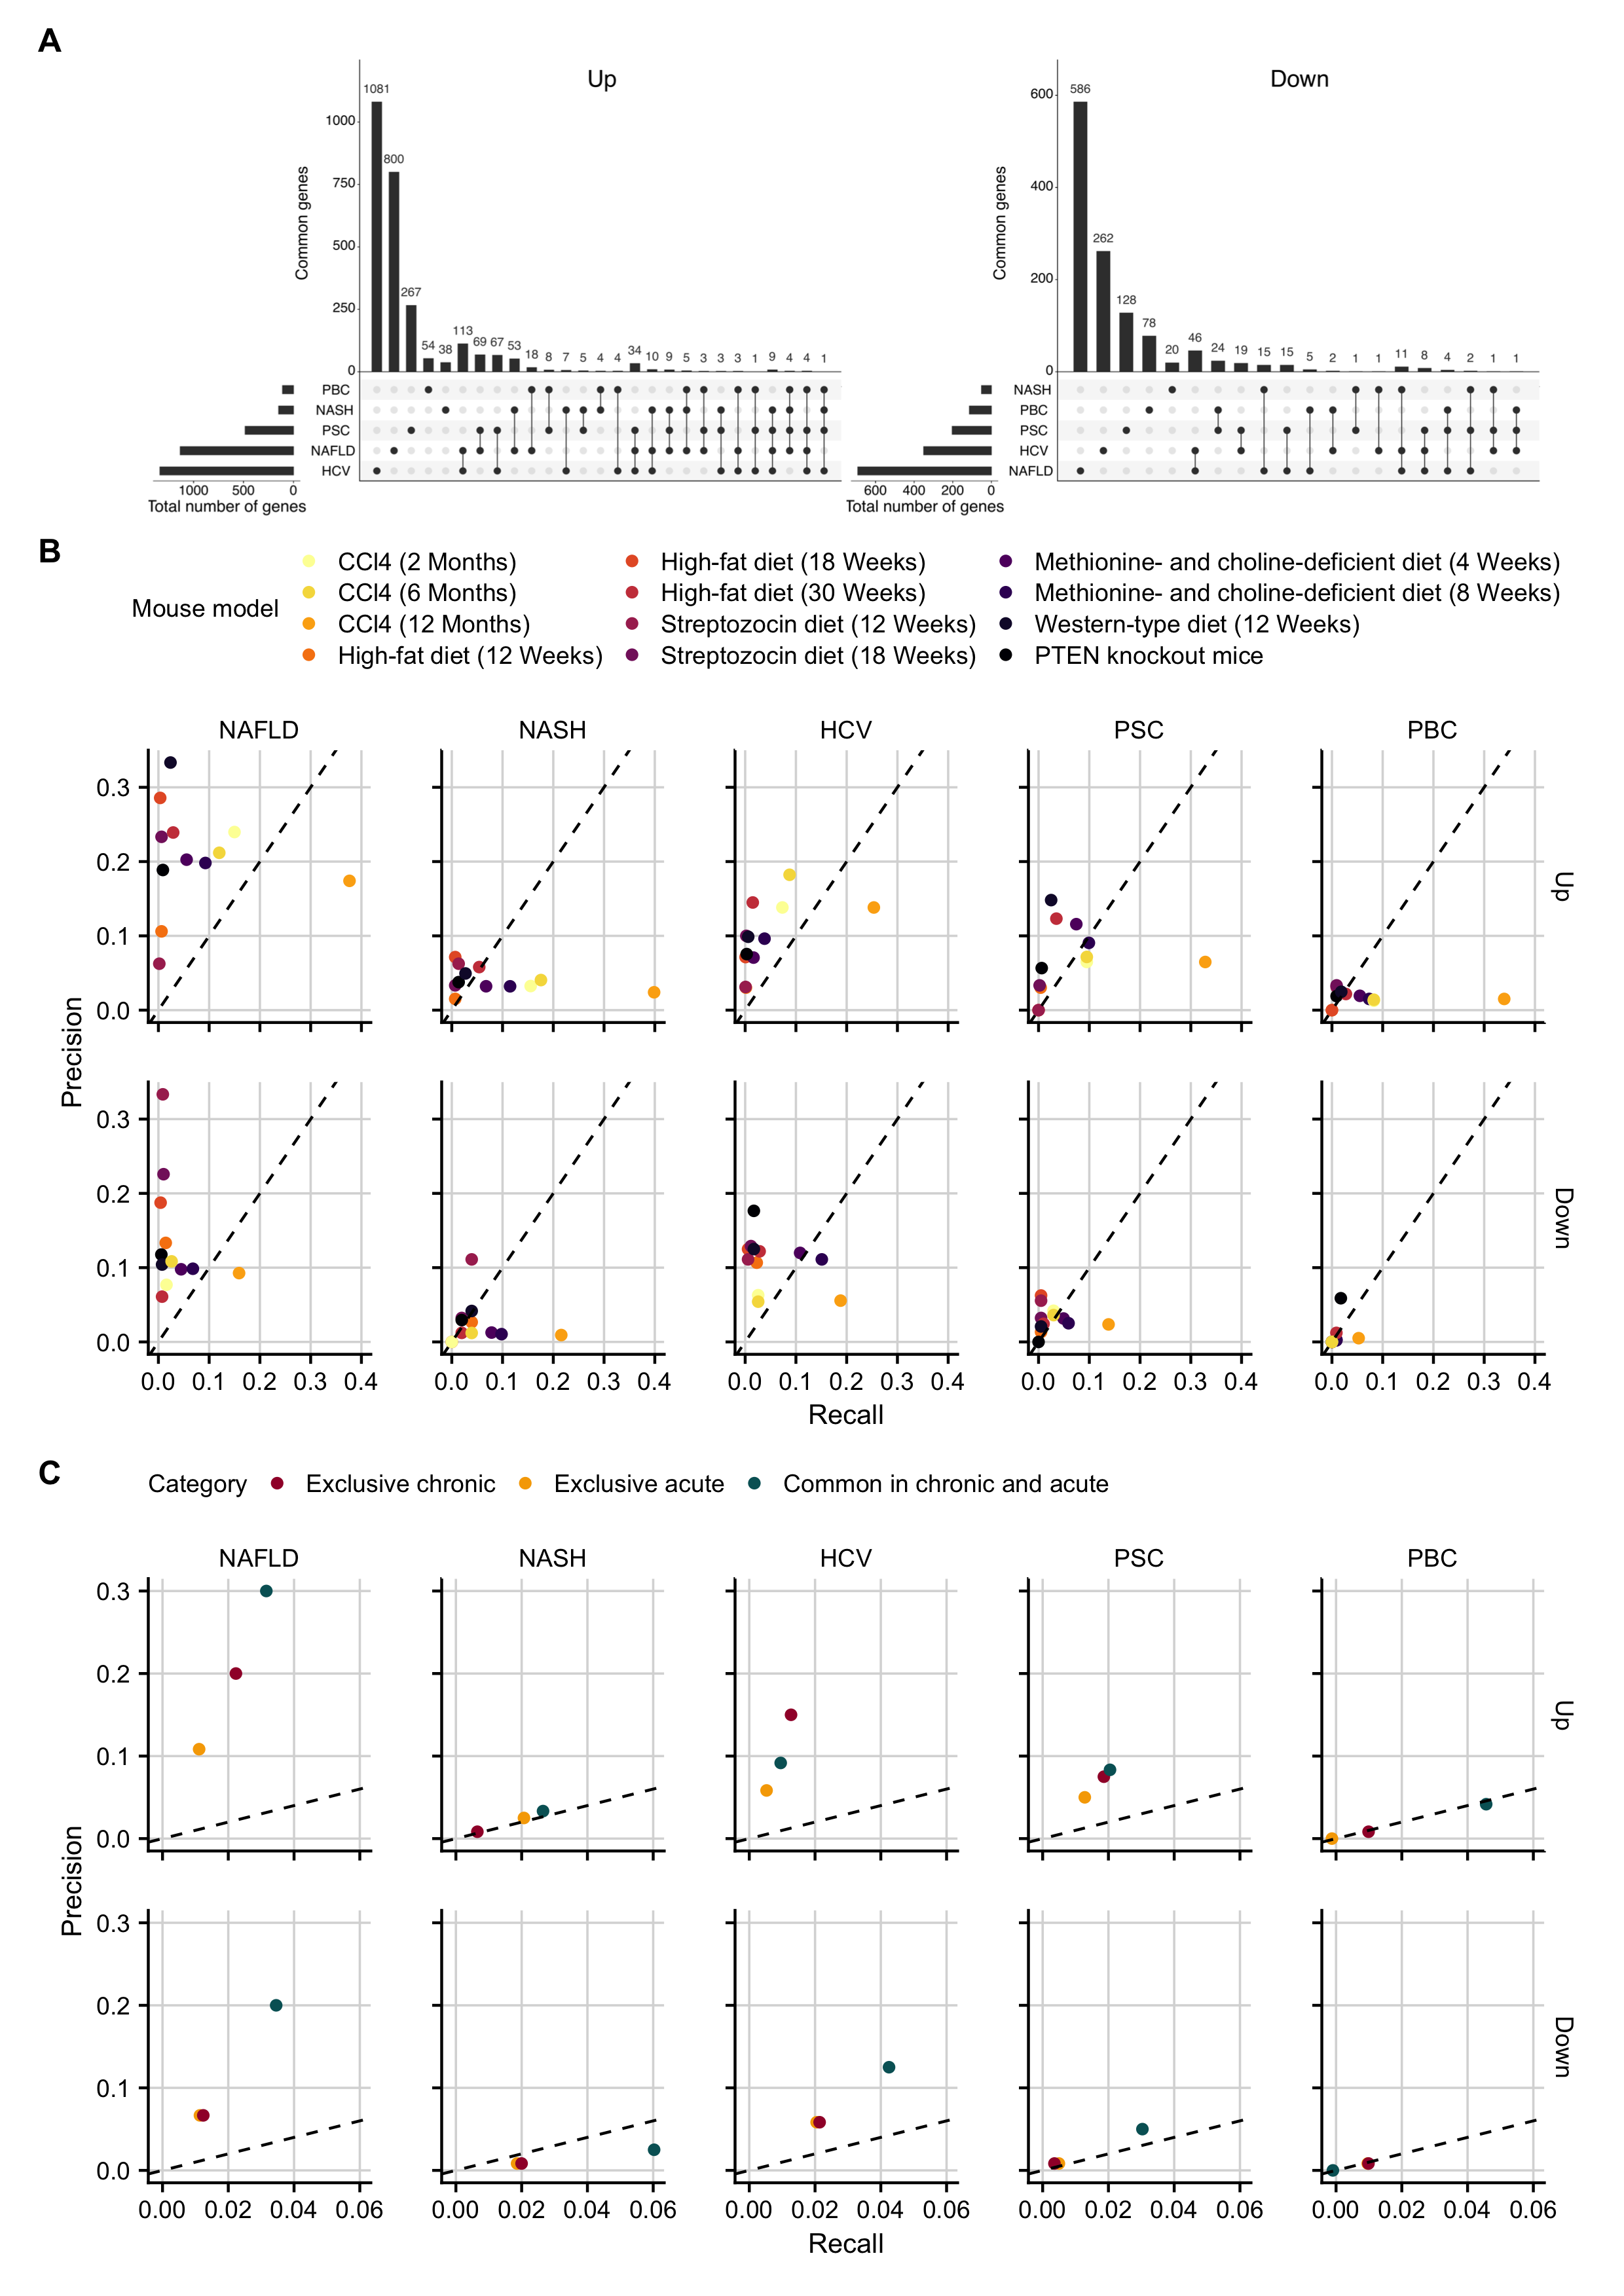
Figure 4.6: Recall and precision of 12 individual mouse models with respect to the human liver diseases NAFLD, NASH, HCV, PBC, and PSC. A. Gene sets that are uniquely or commonly deregulated in individual human diseases. B. Recall and precision of the individual mouse models with respect to the five human liver diseases. All genes with FDR <= 0.05 and |logFC| >= log2(1.5) were included. C. Comparison of exclusive chronic, exclusive acute and common genes in acute and chronic mouse models to human data. To allow a direct comparison, the top 120 genes of each category were included.
4.4.5 Gene browser for comparison of human and mouse liver disease
To facilitate the assessment of the translational relevance of mouse models for specific human liver diseases, I established an open-access gene browser. This application provides for any gene of interest mean expression changes in the individual human and mouse studies, categorization into acute, chronic, or common response sets, the associated cell type, and if the gene is consistently altered in mice and humans.
4.5 Discussion
In the field of CLD, mouse models were successfully used for several preclinical developments (Jansen et al., 2017), though, it is also known that there exist large interspecies differences in the pathophysiology of the human and mouse liver. A former study analyzing the overlap of differentially expressed genes of liver tissue between CLD patients and mouse models with chronic liver injury reported only very little overlap, however, I have revisited this comparison for three reasons. First, the number of CLD patient cohorts with profiled transcriptome has increased in recent years. While the previous mouse-human comparison from 2016 included data from 25 patients with NAFLD and 27 with NASH (Teufel et al., 2016) I included a total 372 expression profiles of patients with NAFLD (n = 147), NASH (n = 42), HCV (n = 23), PBC (n = 11) and PSC (n = 14). Second, it is currently unclear, if longer exposure periods in chronic mouse models will improve the similarity between mice and human CLD. Third, a recent study suggested that a stress response with upregulated inflammatory and downregulated metabolic genes occurs similarly in acute and chronic mouse models and in human CLD. Thus, a comprehensive mouse-human comparison should differentiate between acute, chronic, and common expression responses.
Of all the chronic studies analyzed, the mouse model with 12 months of CCl4 administration resulted in the highest recall of significantly altered genes in human liver disease. In detail, 38, 40, 25, 34, and 33% of all significantly upregulated genes in NAFLD, NASH, HCV, PBC, and PSC, respectively, were upregulated in the 12-month CCl4 mouse model as well (Figure 4.6B). Considering that a previous study reported a low overlap in differentially expressed genes between both species (Teufel et al., 2016) my results show a remarkable higher similarity. I submit that the long exposure time of mice is an important factor for the larger human-mouse overlap The recall of upregulated genes for human NASH was only 0.16 and 0.18 for the models where mice were exposed for 2 or 6 months but increased to ~0.4 after 12 months exposure. This trend was also observed in the other liver disease etiologies. Consequently, the relatively short exposure times used in previous mouse studies may explain the small overlap in differentially expressed genes between humans and mice. Although the recall of downregulated genes was generally lower than that of upregulated genes, the same basic observations were made with respect to time. In contrast to the high recall, precision was lower for the 12-month CCl4 mouse model, suggesting that in addition to a number of human-relevant genes, many other genes are significantly deregulated in mice which is not the case for humans. Of the 12 different mouse models of CLD analyzed, the western-type diet (WTD) had the highest precision (0.33) for human NAFLD. This was not unexpected given the similarity in disease etiology. However, the WTD mouse model had a much lower recall (0.02), which may be due to the relatively short feeding period of only three months. Assuming that WTD has a similar time dependence as the CCl4 model additional studies with longer feeding periods could improve the human-mouse similarity.
From a bioinformatics perspective, overlap analysis of differentially expressed genes may not be the optimal approach to identify a consensus set of genes altered in a specific human CLD and in a mouse model. Instead, I propose enrichment analysis to be superior, as it focuses on the direction of regulation and not the effect size of individual genes. Following this strategy, a more sophisticated comparison of the chronic CCl4 mouse model and human studies identified a set of 228 genes with similar regulation in mouse and human CLD. These genes are enriched in the GO terms migration, development, and morphogenesis, and several are associated with immune cells and ductular reactions. Including scRNA-seq, I found that the upregulated genes were mostly expressed in cholangiocytes, macrophages, endothelial and mesenchymal cells; whereas, the downregulated genes were expressed in hepatocytes. This finding is consistent with the known characteristics of CLD, in which the number of cholangiocytes increases due to ductal reactions, while macrophages, mesenchymal cells, and endothelial cells are involved in inflammatory processes related to GO terms identified among the upregulated genes, such as migration and adhesion. In contrast, genes related to hepatocyte metabolism are mainly downregulated. For selected upregulated genes in mouse and human CLD, their protein expression was analyzed as well. This analysis highlighted the extracellular matrix protein LTBP2, which is involved in anchoring the latent form of TGF-beta to the ECM and plays a role in cell adhesion and tumor promotion (Chen et al., 2019; Michel et al., 1998). Accordingly, LTBP2 staining is negative in the liver of normal mice, weakly positive after 2 and 6 months of CCl4 treatment, and strongly signaled at 12 months. Similarly, positive LTBP2 staining was observed in human PSC and alcoholic liver fibrosis, which increased with the fibrosis stage. I propose for further studies to analyze whether upregulation of LTBP2 is associated with TGF-beta signaling activity, as the TGF-beta pathway is significantly activated. Two other genes that were both upregulated in human and mouse CLD, namely aldoketoreductase AKR1B10 and annexin V, showed a similar pattern in gene and protein expression. Although a more systematic and comprehensive validation is still needed, these preliminary immunostainings suggest that the mouse-human consensus set identified here contains genes that can be validated at the protein level.
To compare the exclusively acute, exclusively chronic, and commonly altered genes in mice with the genes deregulated in human CLD, the group of Jan Hengstler generated additional data on acute challenges in mice. In the different acute challenges induced by chemical and surgical insults, I classified expression changes in exclusively acute, exclusively chronic, and common gene sets. The separation of the three groups seemed relevant to human CLD as exclusively acute genes showed only little overlap with human genes, which is not surprising given the chronic nature of CLD. However, the common genes showed the highest similarity to patient CLD, especially for NAFLD and NASH. This was surprising given the difference in CCl4 damage compared to the hypercaloric, high-fat etiology of human NAFLD/NASH. One explanation may be the recently published hypothesis that different types of injury cause similar expression changes in mouse and human liver, with inflammatory genes upregulated and metabolic genes downregulated (Campos et al., 2020). Exclusively chronic genes with enriched GO processes of development and morphogenesis also showed relatively high similarity, but lower than for the common genes.
In conclusion, my analyses led to the identification of genes that are similarly regulated in human and mouse liver disease. Although major species differences exist, the currently best available mouse models reach a recall of 0.4 and precision of 0.33 with respect to the genes significantly altered in human liver diseases.
4.6 Availability of data and materials
The code to perform all presented analyses is written in R (Gentleman et al., 2004; R Core Team, 2020; Wickham, 2016) and is freely available on Github. Reproducibility of all analyses is ensured by the R package workflowr (version 1.6.2; Blischak, Carbonetto, & Stephens (2019)) by deploying all my analysis scripts at a dedicated webpage. All datasets required to execute the code are available at Zenodo. The transcriptomics raw data of the here analyzed chronic and acute mouse models are available as superseries at GEO under accession number GSE166868.