Chapter 2 Transfer of regulatory knowledge from human to mouse for functional genomics analysis
2.1 Preface
The text of the following chapter is largely taken from the publication “Transfer of regulatory knowledge from human to mouse for functional genomics analysis” (Christian H. Holland, Szalai, et al., 2020) that was originally written by myself. The only changes were made to clarify my contribution to this project. Unless otherwise stated I performed all analyses myself. As the first author of this study the publishing house Elsevier grants me the right to include this work in my dissertation.
2.2 Background
The typical framework of functional genomics studies comprises the analysis of expression changes of groups of genes. These groups are referred to as gene sets and typically consist of genes sharing common functions (e.g. Gene Ontology analysis) or genes encoding for pathway members (Subramanian et al., 2005). The latter are used for classical pathway analysis studies, which assume that the transcript level is a proxy for protein abundance and thus the pathway activity. The framework of estimating transcription factor (TF) activity based on its gene expression follows the same principle (Figure 2.1A). However, mapping the transcript level to proteins neglects the effects of post-transcriptional and post-translational modifications, even though they are essential for the function of many proteins (Mann & Jensen, 2003).
To overcome this limitation, alternative approaches have been developed which are based on newly derived gene sets containing gene signatures obtained from genetic or chemical perturbations of pathways or TFs. These signatures are the footprint on gene expression of the corresponding pathway or TF (Figure 2.1A). Recent studies indicate that footprints outperform mapping gene sets (Cantini et al., 2018; Schubert et al., 2018). Since most of these footprints are generated for the application in humans, their usability in model organisms is uncertain. This question is of importance since the study of human diseases is limited by the availability of patient data and ethical concerns, and are thus often complemented with experimental work in model organisms, in particular mice (Mus musculus) (Fox, Barthold, Newcomer, Smith, & Quimby, 2006).
Perturbation of gene expression in humans can be estimated from mouse transcriptomic data (Brubaker, Proctor, Haigis, & Lauffenburger, 2019; Normand et al., 2018). Furthermore, previous studies suggest that pathway and TF footprints are evolutionarily conserved between mice and humans: pathway footprints derived from mouse B cells can provide valuable insights into human cancer (Tenenbaum, Walker, Utz, & Butte, 2008), and inferred prostate-specific gene regulatory networks of mice and humans overlap by over 70% (Aytes et al., 2014). This suggests that human functional genomics tools, which consider footprints as gene sets, could be applied on mice data. However, as of today there is no comprehensive study to prove this.
To validate whether pathway and TF footprints are evolutionarily conserved between mice and humans I performed a comprehensive benchmark study. I exploited two state of the art functional genomics approaches covering both aspects of gene regulatory networks: signaling pathways and transcriptional regulation. The first approach is PROGENy, a tool that estimated the activity of, originally, 11 signaling pathways from gene expression data (Schubert et al., 2018). It is based on consensus transcriptomic perturbation signatures, I refer to as footprints, of signaling pathways on gene expression. In this work Bence Szalai extended PROGENy with novel footprints of the signaling pathways Androgen, Estrogen, and WNT. The second approach is DoRothEA, a resource matching TFs with their transcriptional targets (Garcia-Alonso et al., 2019), which allows me to estimate TF activity from gene expression data in humans by enriched regulon analysis (Alvarez et al., 2016). I consider the targets of a TF also as footprints of a TF on gene expression. I validated that both PROGENy and DoRothEA can recover mice perturbations, supporting my hypothesis about the conserved nature of pathway and TF footprints. To demonstrate the usability of PROGENy and DoRothEA I estimated pathway and TF activities for a large collection of mice and human diseases as well as chemical and genetic perturbation experiments. Based on the activities of the disease experiments I were able to recover known pathway/TF disease associations. For this, I constructed 738 novel disease sets matching 186 diseases with 467 disease experiments.
2.3 Methods
2.3.1 Benchmark dataset collection
I collected transcriptomic perturbation experiments in human and mouse profiled by single-channel microarrays from the database CREEDS (Zichen Wang et al., 2016), which contains among others resources single drug and single gene perturbation experiments from Gene Expression Omnibus (GEO). I extended this collection with manually curated perturbation experiments from ArrayExpress using the data collection and curation pipeline described previously (Schubert et al., 2018). Arrays with no raw data available or with no corresponding annotation package were discarded. I translated GEO accession ids to ArrayExpress accession ids and downloaded CEL files for all experiments using the function ArrayExpress from the BioConductor package ArrayExpress (version 1.40.0; Kauffmann et al. (2009)).
2.3.2 New PROGENy pathway
PROGENy is based on footprints which are consensus gene signatures delivered from pathway-related perturbation experiments. Bence Szalai added 3 new pathways footprints (Androgen, Estrogen and WNT) to the existing 11 pathways of PROGENy in this study. To collect the corresponding perturbation experiments, he queried ArrayExpress (Kauffmann et al., 2009) with keywords {‘androgen’, ’DHT’, ‘testosterone’}, {‘estrogen’, ‘SERM’, ‘tamoxifen’} and {‘APC’, ‘axin’, ‘catenin’, ‘Frizzled’, ‘GSK3’, ‘WNT’} for Androgen, Estrogen and WNT pathways, respectively. For further curation and PROGENy model fitting he used the pipeline described previously (Schubert et al., 2018).
2.3.3 Microarray processing
The processing steps from raw data to annotated probe levels, comprising quality control, background correction, normalization and annotation is described in the original PROGENy paper (Schubert et al., 2018).
Experiments with less than two control replicates remaining after the processing step were discarded. I used the BioConductor package limma (version 3.36.2; Phipson, Lee, Majewski, Alexander, & Smyth (2016)) to perform differential expression analysis calculating the contrast between perturbed and control replicates. Instead of log-fold changes I considered the moderated t-value as gene-level statistic.
2.3.4 Construction of mouse-PROGENy and calculation of pathway activities
The original PROGENy model is a matrix with footprint genes in rows and pathways in columns. The entries denote a measure accounting for how genes respond to pathway perturbation (up- or downregulation). Each pathway is limited to the top 100 most responsive genes.
To construct mouse-PROGENy I mapped the HGNC symbols of the original PROGENy matrix to their ortholog MGI-symbol using the BioConductor package biomaRt (version 2.36.1, ensembl release 96 April 2019; Durinck, Spellman, Birney, & Huber (2009)). The mapping can lead to duplicated genes. Either a single HGNC symbol is mapped to several MGI symbols or several HGNC symbols are mapped to a single MGI symbol. In the first case, the weight of the HGNC symbol is divided by the number of mapping MGI genes. In the second case, the weight of the new MGI symbol is the arithmetic mean value of all mapping HGNC symbols. Following this strategy I introduce a bias to human genes which have multiple orthologs in mice (e.g. the gene SERPINA3 that belongs to the footprint of JAK-STAT maps to 10 mouse genes: Serpina3a/b/c/f/g/i/j/k/m/n. Hence the JAK-STAT pathway is biased to SERPINA3). In order to compensate for this bias I extend the pathway footprints with a number of additional genes equal to the number of ortholog genes per human gene - 1. Finally, a mouse specific PROGENy matrix is retrieved (mouse-PROGENy) so that I can estimate pathway activity scores from mice gene expression data for the original 11 (EGFR, Hypoxia, JAK-STAT, MAPK, NFkB, p53, PI3K, TGFb, TNFa, Trail, VEGF) and the 3 newly added (Androgen, Estrogen, WNT) pathways. The pathway activity scores are calculated for each contrast using moderated t-values as gene-level statistic. Activity scores are pathway-wise z-score normalized.
2.3.5 Construction of mouse-DoRothEA and calculation of TF activities
DoRothEA is a resource linking human TFs to their direct transcriptional targets. Each TF is accompanied with a summary confidence level from A (high confidence) to E (low confidence) based on the amount of supporting TF’s regulatory evidence. I inferred mouse-DoRothEA by mapping HGNC-symbols to their ortholog MGI-symbol using the BioConductor package BiomaRt (version 2.36.1, ensembl release 96 April 2019; Durinck et al. (2009)). The mapping can lead to TFs with multiple confidence levels. To be more conservative, the lowest confidence level is chosen as TF-confidence level. The BioConductor package viper (version 1.14.0; Alvarez et al. (2016)) considers the regulons as gene sets and, thus, estimates TF activities from gene expression data using enriched regulon analysis. TF activity scores are computed for each contrast using moderated t-values as gene-level statistic. Only regulons comprised of at least 4 targets are tested. I consider the normalized enrichment score (NES) provided by viper as a measure for TF activity.
2.3.6 Quality control of single gene perturbation experiments
Single gene perturbation experiments provide the possibility for an intuitive quality control of the effect of the perturbation. If the gene-level statistic (t-value) sign of the perturbation target is not in agreement with the underlying perturbation ((+) for overexpression, (-) for knockdown/knockout) the perturbation experiment is considered unsuccessful and is thus discarded.
2.3.7 Computing ROC and PR curves
To transform the benchmark into a binary setup, all activity scores of experiments with negative perturbation effect (inhibition/knockdown) are multiplied by -1. This guarantees, that TFs/pathways belong to a binary class either deregulated or not regulated.
I computed the ROC-curves and associated statistics using the R package pROC (version 1.12.1; Robin et al. (2011)). For PR-curves I used the R package PRROC (version 1.3.1; Grau, Grosse, & Keilwagen (2015)). For the construction of ROC and PR curves I calculated for each perturbation experiment pathway (or TF) activities using PROGENy (or DoRothEA). As each perturbation experiment targets either a single pathway (or TF) only the activity score of the perturbed pathway (or TF) is associated with the positive class (e.g. EGFR pathway activity score in an experiment where EGFR was perturbed). Accordingly the activity scores of all non-perturbed pathways (or TFs) belong to the negative class (e.g. EGFR pathway activity score in an experiment where JAK-STAT pathway was perturbed). Using these positive and negative classes Sensitivity/(1-Specificity) or Precision/Recall values were calculated at different thresholds of activity, producing the ROC/PRC curves.
2.3.8 Downsampling true negatives
ROC curves are recommended when the numbers of true positives and true negatives are balanced (J. Davis & Goadrich, 2006). In order to balance my benchmark dataset I downsampled the number of true negatives to equal the number of true positives 3000 times and computed AUROC for each run.
2.3.9 Inference of disease sets using disease ontology network
To create disease sets I determined all related parent diseases of the diseases studied in CREEDs by using the function ancestors from the BioConductor package rols (version 2.9.1; https://github.com/lgatto/rols/) which provides an R interface to the Ontology Lookup service (J, B, L, & Parkinson, 2015). Each possible parent disease serves as a distinct disease set. CREEDs disease experiments which matches a child disease of a given disease set is considered as a set member.
2.3.10 Disease set enrichment analysis
To explore TF/Pathway-disease associations I downloaded all human and mouse disease signatures from the CREEDs database (Zichen Wang et al., 2016). I followed the processing steps described before resulting in an expression vector of moderated t-values for each disease experiment. I computed pathway and TF activity scores for each vector. To apply the Gene Set Enrichment Analysis framework (Subramanian et al., 2005) with my disease sets I used the BioConductor package fgsea (version 1.6.0; Sergushichev (2016)). Separately for each pathway/TF (e.g. only for EGFR), disease experiments (with associated diseases) are ranked based on the pathway/TF activity score (e.g. the activity score of EGFR). Subsequently, it is tested whether experiments belonging to the same disease set are enriched either at the top or at the bottom of the list. Disease sets with less than 5 and more than 45 members were discarded. P-values were adjusted for multiple comparisons using false discovery rate (FDR) (Benjamini & Hochberg, 1995).
2.4 Results
2.4.1 Benchmark pipeline
I established a benchmark pipeline to discover whether both PROGENy and DoRothEA human footprint methods could be applied to functionally characterize mice data (Figure 2.1B). Pathway/TF perturbation gene expression studies provide the opportunity to benchmark both tools: I can compare the predicted pathway and TF activities with the ‘ground truth’, denoted as the original perturbed target. The database CREEDS (CRowd Extracted Expression of Differential Signatures) provides manually curated single drug and single gene perturbation experiments in human and mice (Zichen Wang et al., 2016). Additionally, I manually curated single drug perturbation experiments (see Methods). I included both perturbation directions - either activation/overexpression or inhibition/knockdown.
For the PROGENy validation I exploited both single drug and single gene perturbation studies. Experiments are considered to be relevant for my study if the perturbation target is a member or a gene encoding for a member of a PROGENy signaling pathway. I identified 347 experiments (123 single gene and 224 single drug perturbation; Figure 2.1C). These experiments cover 11 and 13 out of 14 possible pathways for human and mouse, respectively. These 14 pathways include Androgen, Estrogen, and WNT besides the 11 in the original PROGENy publication (see Methods) (Schubert et al., 2018). For DoRothEA I extracted only those single gene perturbation experiments where the target gene encodes for a TF which is defined by the human TF census from TFClass (Wingender, Schoeps, Haubrock, Krull, & Dönitz, 2018). In total I collected 302 single gene perturbation experiments covering 144 mouse TFs (Figure 2.1D).
To evaluate if PROGENy is applicable on mice data in the fairest way I would need to compare mouse-PROGENy vs a PROGENy version which was originally developed for application in mice. Since, to my knowledge, this resource does not currently exist I compared the performance of the newly derived mouse-PROGENy versus the original human-PROGENy tool. Note that this procedure introduces a bias towards the benchmark data as I benchmark mouse-PROGENy and human-PROGENy on independent data sets: one with human and the other with mouse pathway perturbation experiments. Regarding DoRothEA, there are resources that provide TF-target interactions for mice. Hence, I compared the newly derived mouse-DoRothEA versus dedicated mouse regulons from the TRRUST database (Han et al., 2018). Both mouse-PROGENy and mouse-DoRothEA were constructed by mapping human genes to their orthologs in mice (see Methods). To assess the model’s prediction power I utilized the Receiver Operating Characteristic (ROC) and Precision-Recall (PR) curves (see Methods).
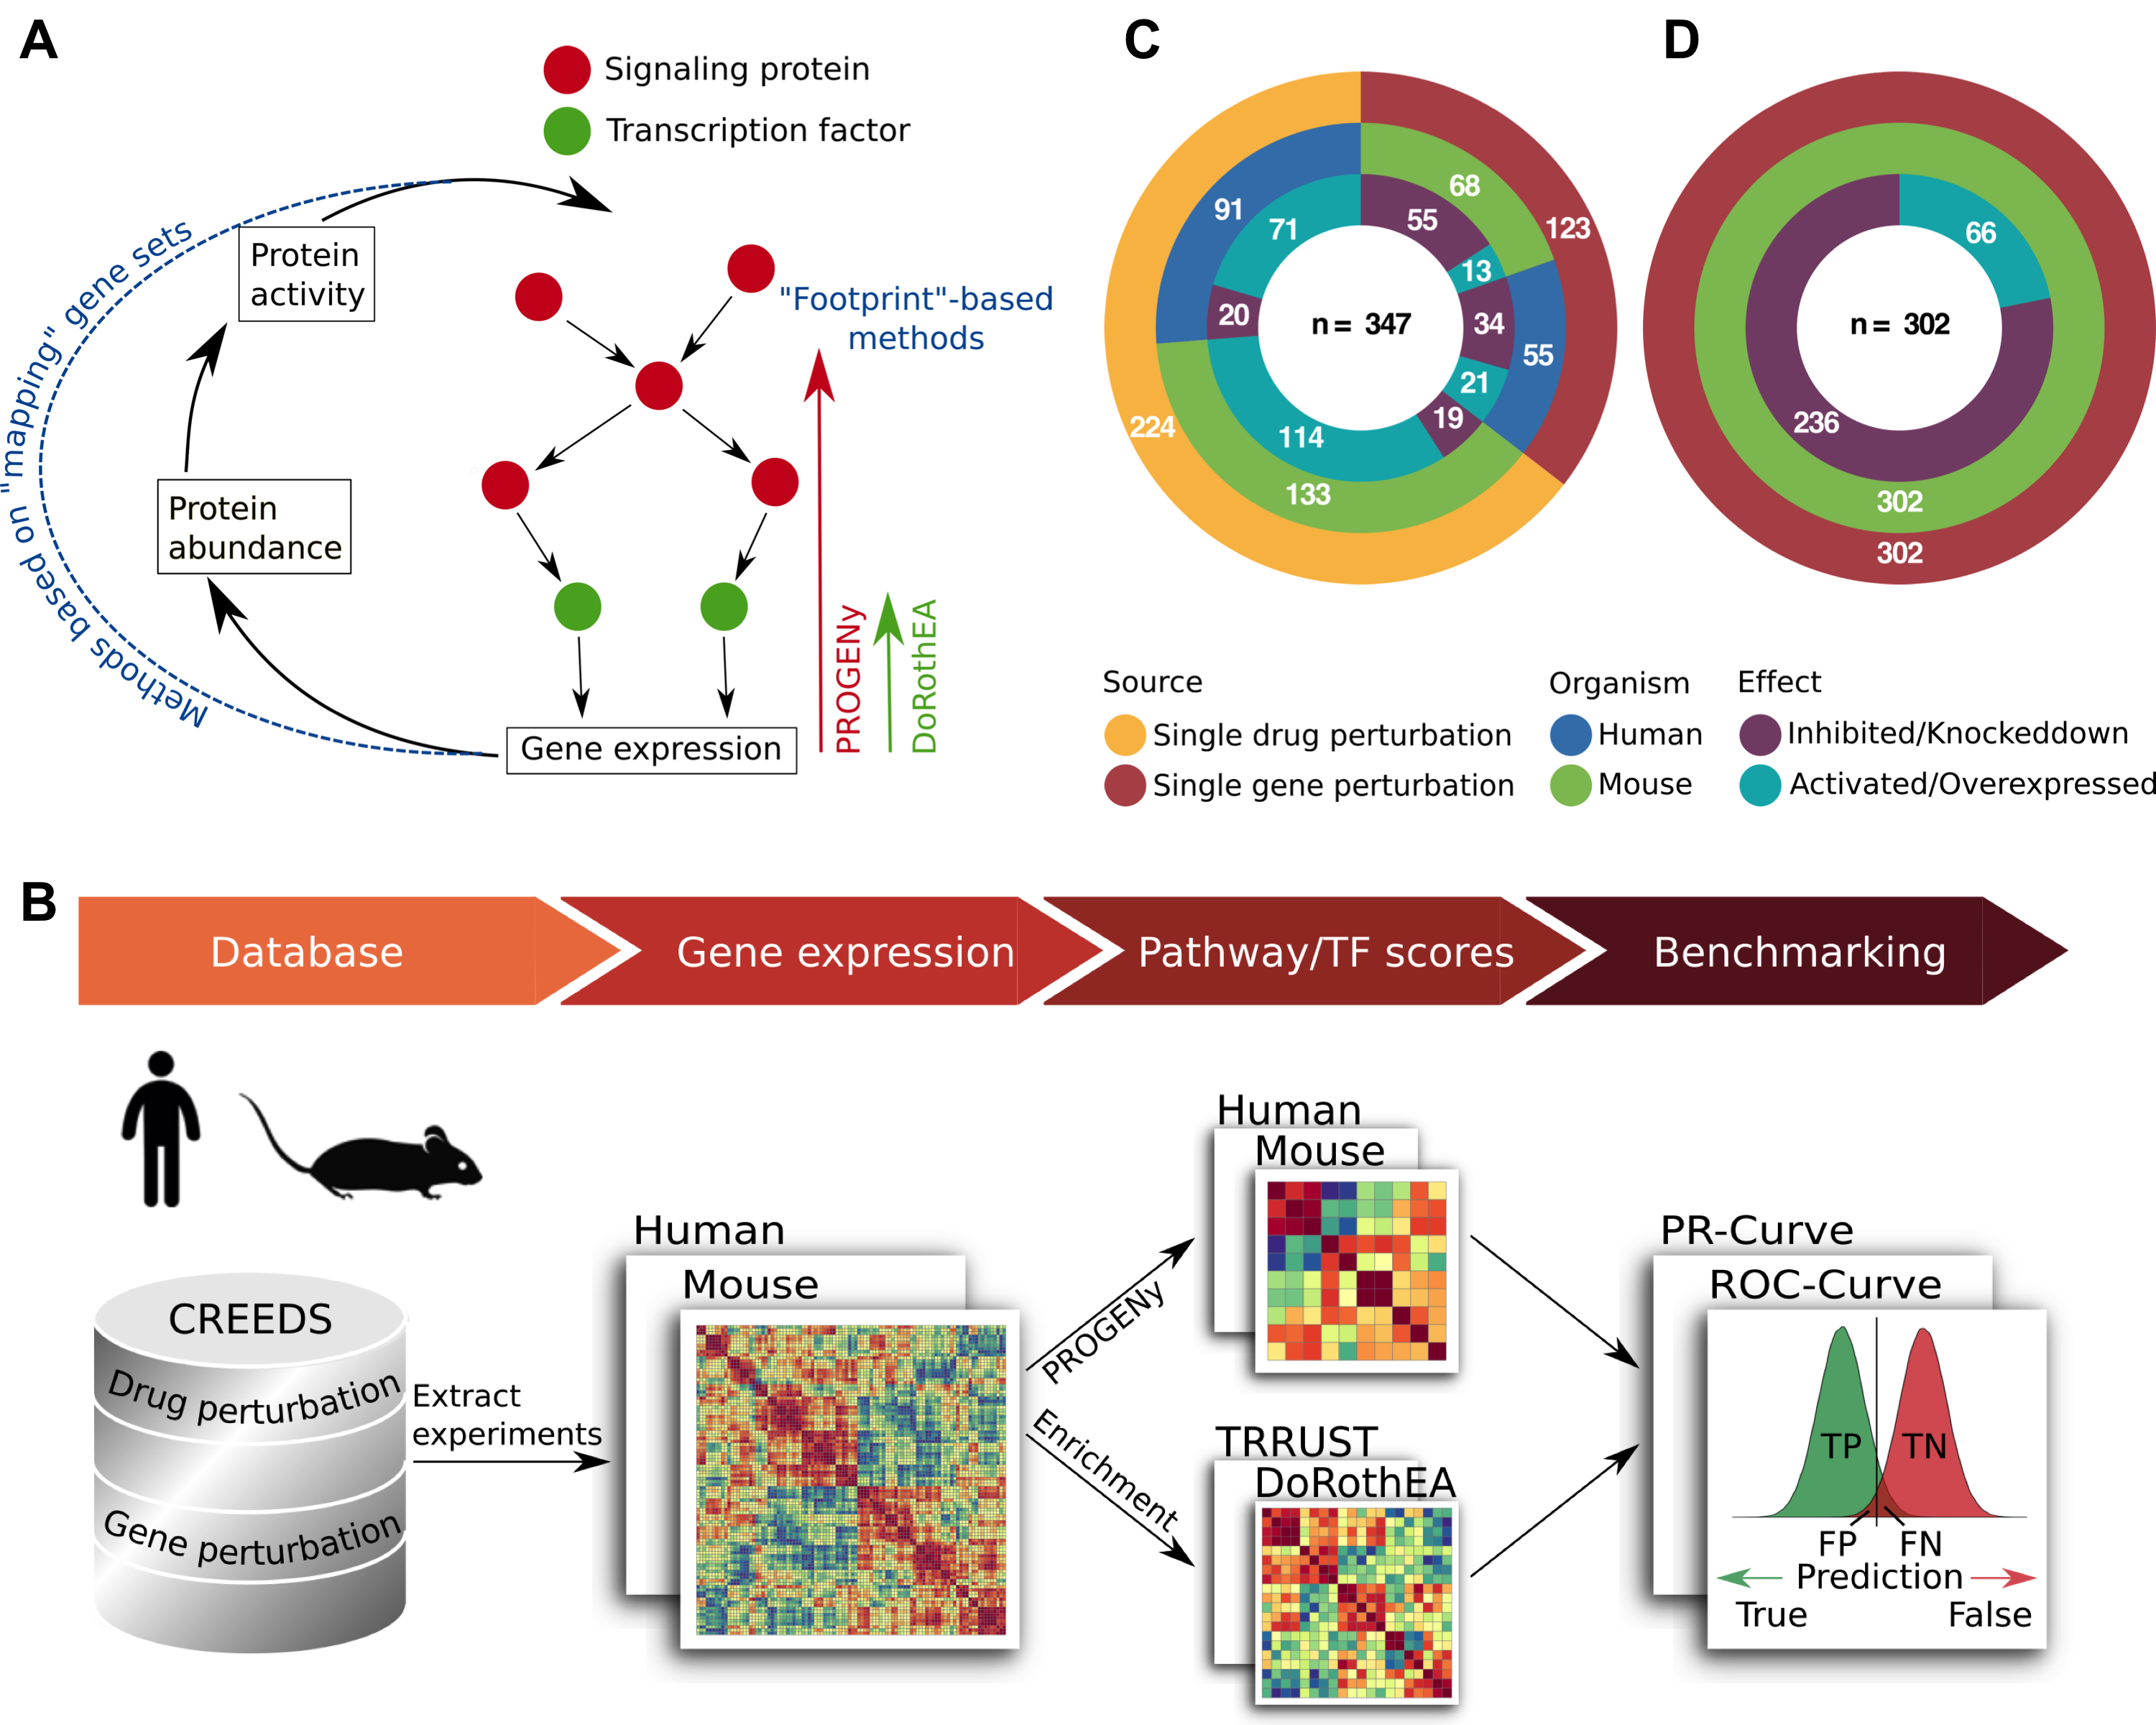
Figure 2.1: Benchmark overview. (A) Visualization of the classical ‘mapping’ framework, where transcript level is mapped to protein level and thus to protein activity in contrast to the footprint based methods PROGENy and DoRothEA. (B) Benchmark pipeline starting with the extraction of mouse and human single gene and single drug perturbation experiments from the CREEDs database. Pathway and TF activities are computed for each experiment separately based on their differential expression signature. For the PROGENy benchmark I compared human-PROGENy vs mouse-PROGENy. For DoRothEA benchmark I compared mouse-DoRothEA vs dedicated mouse regulons from TRRUST. I evaluate the performance of both approaches using ROC and PR-metrics. (CD) Overview of benchmark datasets for PROGENy (C) and DoRothEA (D), including the perturbation type, organism, and perturbation effect. Numbers indicate the amount of experiments in each group.
2.4.2 Benchmarking PROGENy
To compare mouse-PROGENy and human-PROGENy unbiasedly, I included only pathways perturbed in both benchmark datasets. Moreover, I evaluated PROGENy’s global performance across all pathways. Both models clearly performed better than random (AUROC of 0.71 with 95% confidence interval of 0.662–0.757 and AUROC of 0.656 with 95% confidence interval of 0.610–0.703 for human and mouse-PROGENy respectively; Figure 2.2A; ROC-curves for each pathway in Supplementary Figure A.1). AUROC was not significantly different between mouse and human (DeLong-test, p = 0.113). As my benchmark dataset is imbalanced (10% belong to the positive class) I also computed AUROC’s upon multiple downsampling true negatives to equal the number of true positives with a resulting median AUROC equal to the AUROC of the unbalanced dataset (see Methods; Supplementary Figure A.2A and B). With precision-recall analysis, I obtained consistent results: human-PROGENy performed comparably to mouse-PROGENy (AUPRC of 0.254 and 0.246, respectively; Figure 2.2B; PR-curves for each pathway are provided in Supplementary Figure A.3. In addition, both performed better than a random model which would result in an AUPRC of 0.1. In summary, mouse-PROGENy performed comparably to human-PROGENy and better than a random model, regardless of the metric used. Thus, I conclude that PROGENy can recover pathway perturbations in mice.
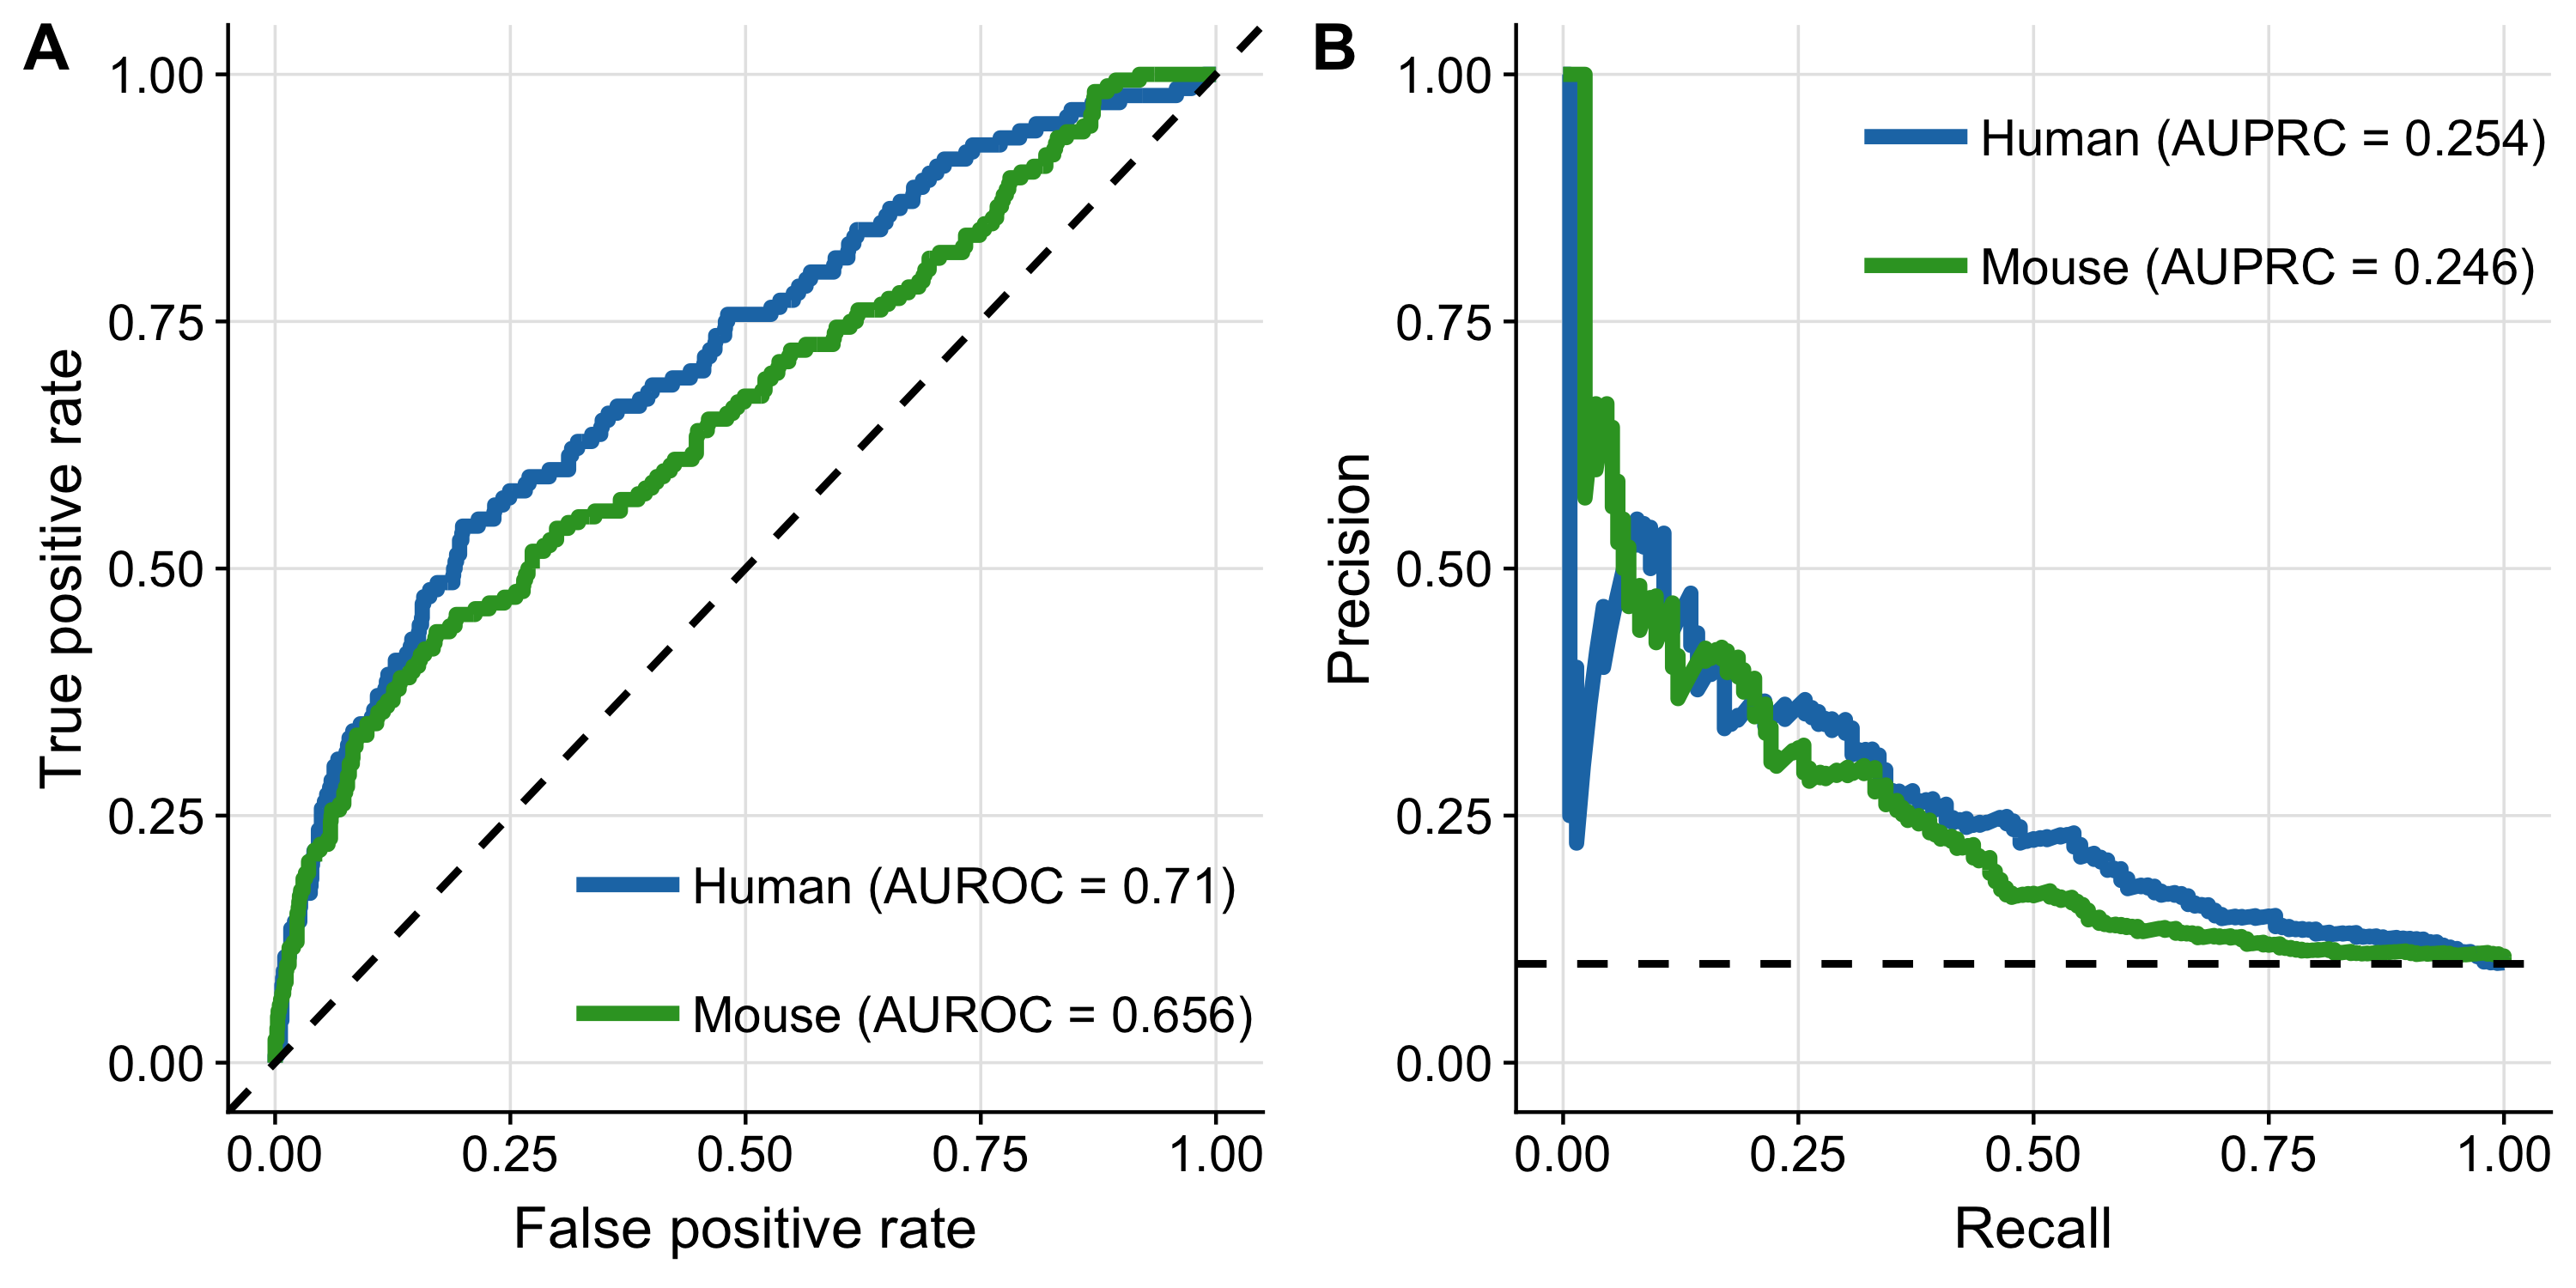
Figure 2.2: Benchmark of mouse-PROGENy. ROC-curve (A) and PR-curve (B) analysis comparing human-PROGENy vs. mouse-PROGENy. Dashed lines indicate the performance of a random models.
2.4.3 Benchmarking DoRothEA
To evaluate if DoRothEA’s regulons can functionally characterize mice data, I next compared the performance of mouse-DoRothEA to the performance of dedicated mouse regulons from the TRRUST database (Han et al., 2018). Human-DoRothEA was reconstructed by integrating different resources spanning from literature-curated databases to predictions of TF-target interactions (Garcia-Alonso et al., 2019). Thereby, each TF is accompanied with a summary confidence level from A (high confidence) to E (low confidence) based on the amount of supporting TF’s regulatory evidence. My novel mouse-DoRothEA regulons comprise in total 1170 TFs, targeting 17,512 unique targets with 402,937 interactions distributed across all confidence levels (see Methods; Supplementary Figure A.4A). In contrast, TRRUST covers 828 TFs, which overlap 553 TFs from mouse-DoRothEA (Supplementary Figure A.4B). Comparing similarity of overlapping regulons between TRRUST and mouse-DoRothEA revealed, for most regulons, substantial differences (Supplementary Figure A.4C). To benchmark the performance of mouse-DoRothEA and TRRUST unbiasedly, I consider only the 553 TFs which are available in both resources. I cover 34–76 TFs of those 553 TFs (dependent on mouse-DoRothEA confidence level) with my benchmark data (Supplementary Figure A.4D). Moreover, I evaluated DoRothEA’s global performance across all TFs since there were not enough public data sets available to evaluate the performance at the TF level. In ROC space mouse-DoRothEA outperformed TRRUST at any confidence level combination (Figure 2.3A). However, in PR space I found that that TRRUST has an advantage throughout all confidence level combinations except AB where DoRothEA is slightly better (Figure 2.3B). All model subtypes performed better than a corresponding random model. In both metrics, I saw a peak at combined confidence level of A and B. Therefore, I decided to consider only TFs accompanied with the confidence levels A and B in the following analysis.
While both regulons resources performed better than random, mouse-DoRothEA (AUROC: 0.711, 95% confidence interval: 0.649–0.772) performed better than TRRUST (AUROC: 0.671, 95% confidence interval: 0.604–0.738; Figure 2.3C), but without a significant difference (DeLong-test, p = 0.249). As the DoRothEA benchmark dataset is even more imbalanced (2.63% belong to the positive class) I downsampled again true negatives to equal the number of true positives, showing that the median of downsampled AUROC is equal to the AUROC of the imbalanced dataset (see Methods; Supplementary Figure A.5A and B). In PR-space mouse-DoRothEA performed just as well as TRRUST (AUPRC of 0.108 for both; Figure 2.3D). Also both performed better than a random model with a corresponding AUPRC of 0.026. Considering the aforementioned results, I conclude that mouse-DoRothEA performs comparably to TRRUST and can thus recover transcriptional regulation in mice.
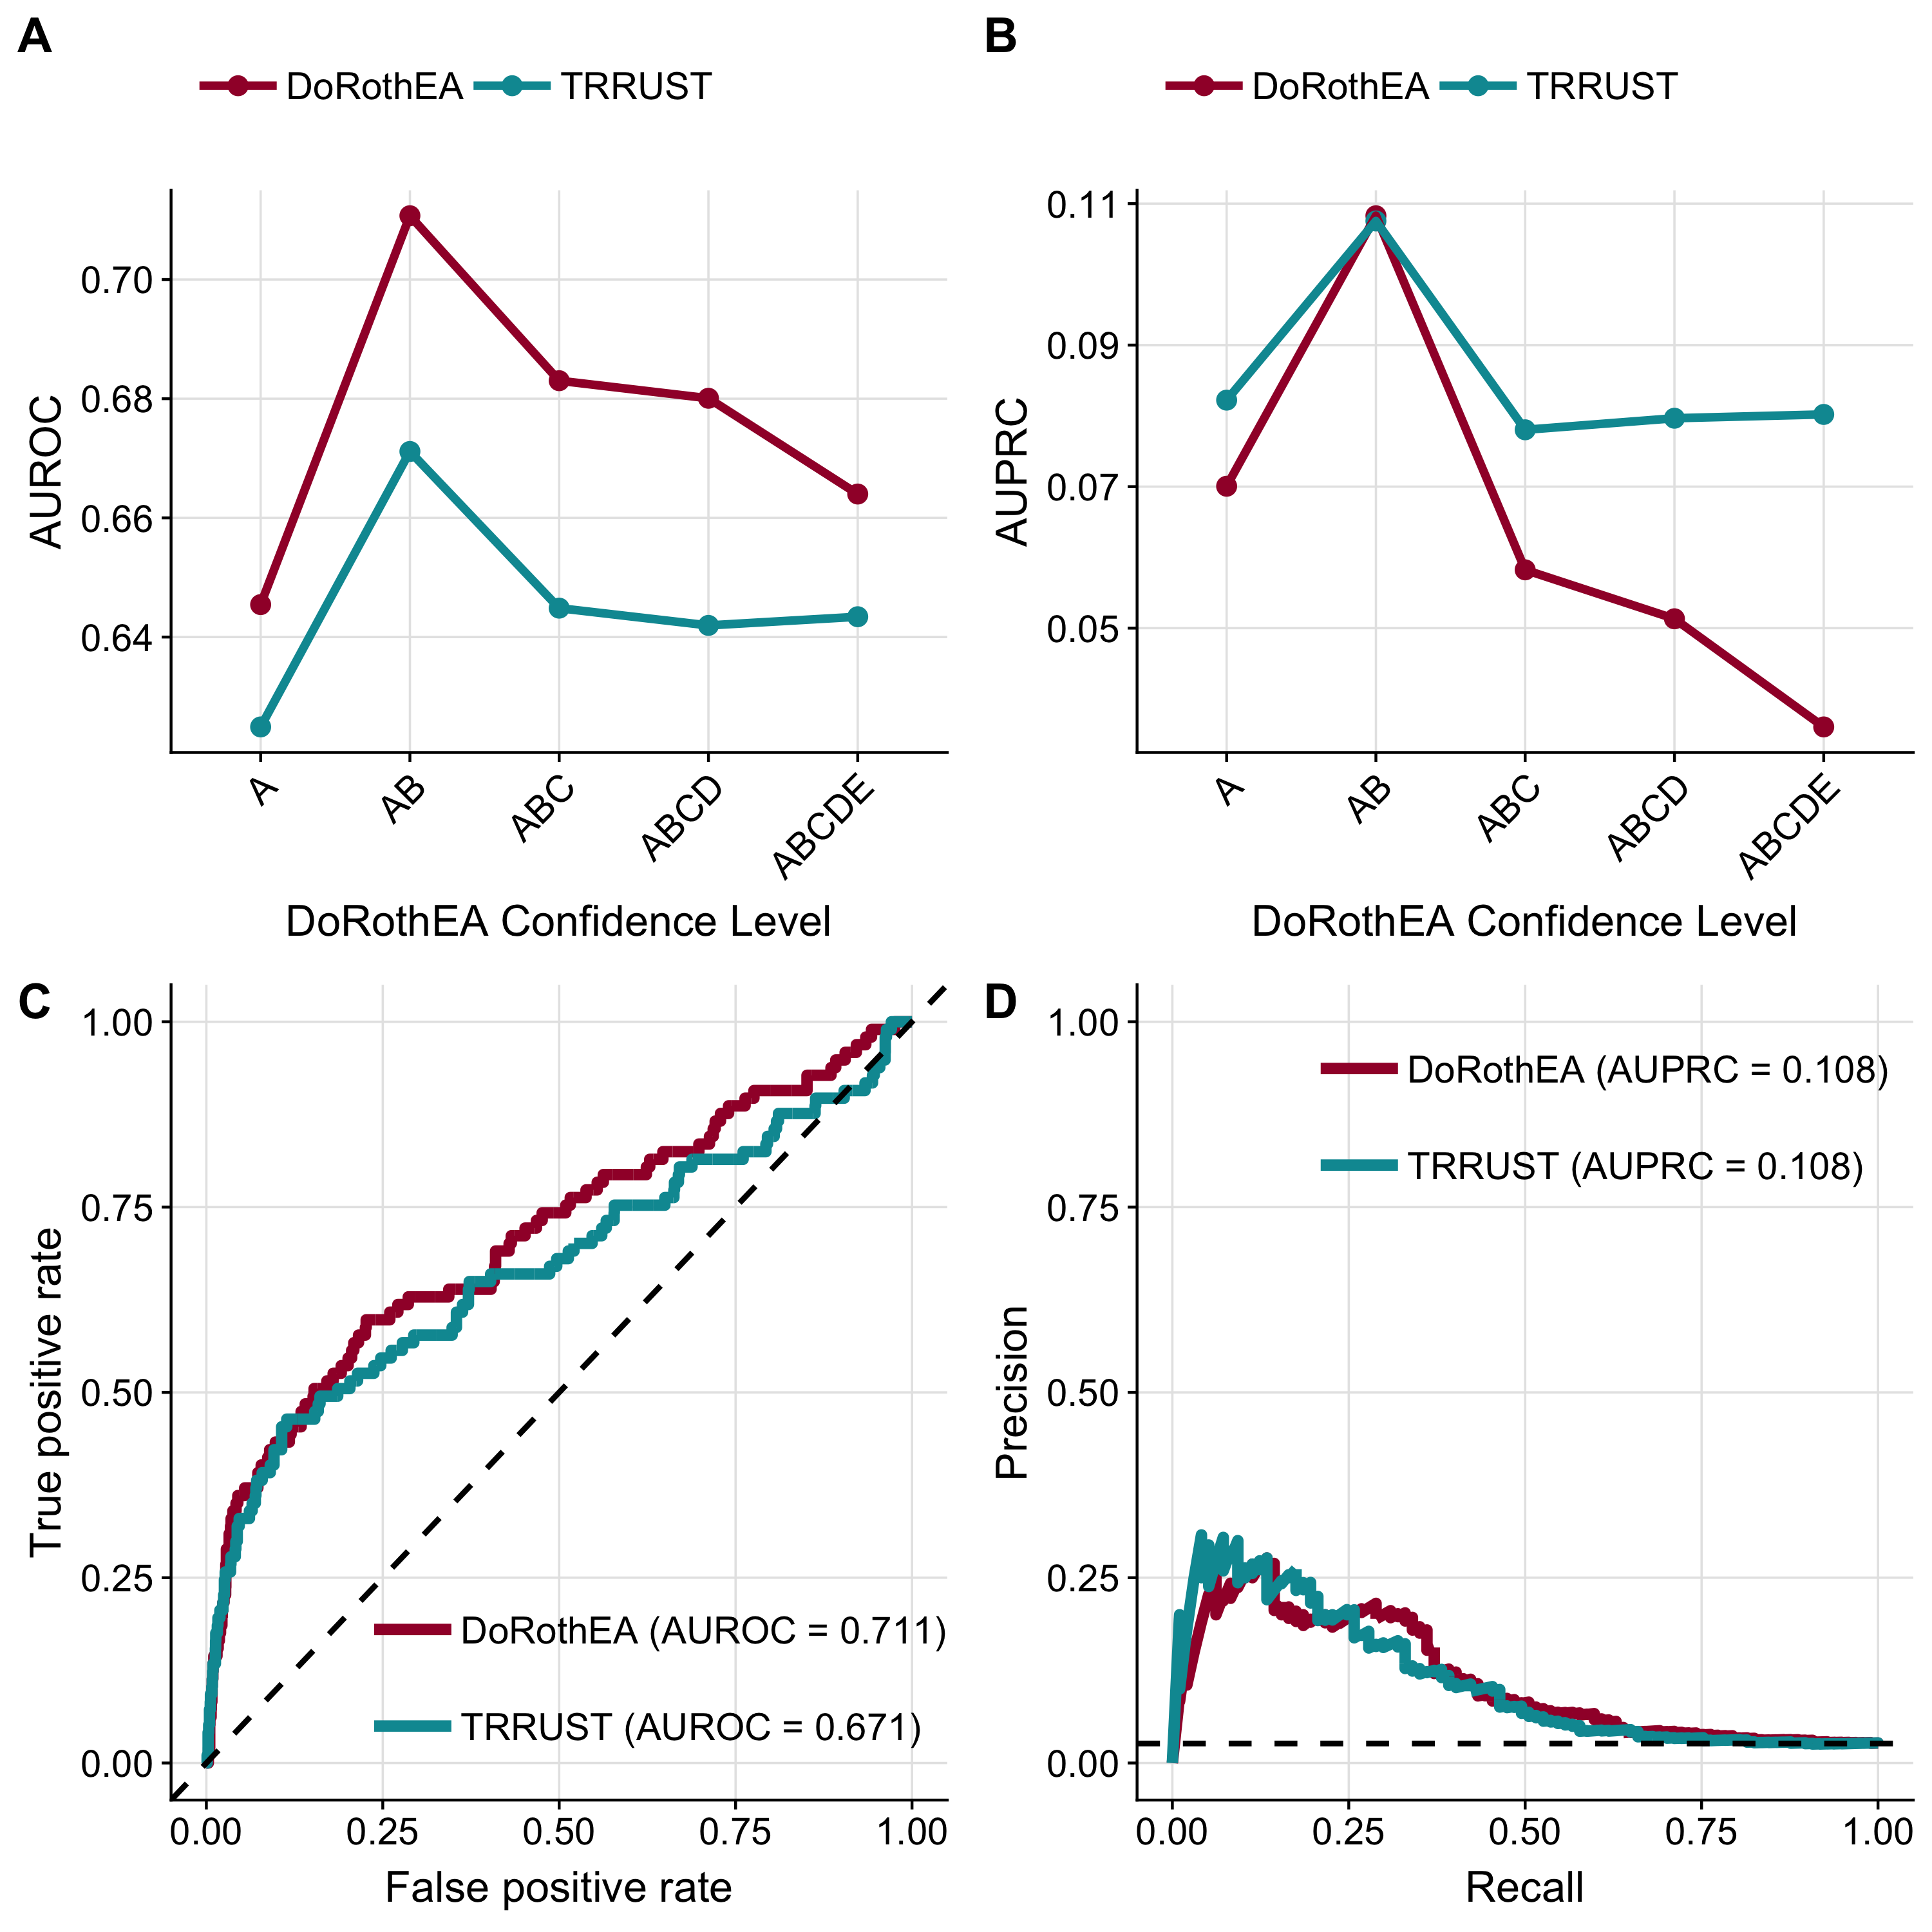
Figure 2.3: Benchmark of mouse-DoRothEA. DoRothEA result of ROC-curve (A) and PR-curve (B) analysis summarized in AUROC and AUPRC, respectively, for different confidence level cutoffs. ROC-curve (C) and PR-curve (D) analysis comparing mouse-DoRothEA filtered for TFs with confidence level A or B vs. mouse-TRRUST. Dashed lines indicate the performance of a random model.
2.4.4 Pathway/TF-disease associations
Once shown that PROGENy and DoRothEA can also be applied to mice data, I investigated whether I can recover known associations between pathways/TFs and human diseases based on transcriptomic disease signatures of both mice and humans. I downloaded 469 disease signatures from the CREEDs database (Zichen Wang et al., 2016) and computed pathway and TF activity scores for each experiment. To find associations I developed individual disease sets based on a disease ontology network from EBI Ontology Lookup Service (J et al., 2015). Each node in this network represents a distinct disease set. If a node itself or a descendant of a node matched a CREEDs signature disease, the corresponding CREEDs experiment is considered as a member of the disease set (Figure 2.4A). In total I tested 732 distinct disease sets. Using these disease sets I found 434 significant (Gene set Enrichment Analysis (Subramanian et al., 2005); FDR \(\le\) 0.1 & |NES| \(\ge\) 1; see Methods) pathway-disease associations and 3586 significant (FDR \(\le\) 0.1 |NES| \(\ge\) 1) TF-disease associations covering 156 and 281 disease sets, respectively.
The results were, in general, dominated by upregulated activity of two TFs, ETS2 (100 associations) and E2F1 (88 associations; Figure 2.4B). Both are well-known oncogenes driving tumorigenesis (Fry & Inoue, 2018; Johnson, 2000). Accordingly, most of their associations I found were related to different forms of cancer. Similarly, I found the activity of the tumor suppressor TP53 to be downregulated in cancer (7 associations). Pathway specific associations were dominated by the PI3K pathway (86 associations; Figure 2.4C). Additionally, almost half of them were associations with different forms of cancer. My approach revealed for the majority of all cancer associations an elevated activity level of PI3K. This finding is in agreement with the literature that describes PI3K as having control over important hallmarks of cancer, i.e. cell cycle, survival, and metabolism (Fruman & Rommel, 2014). Also I found a strong upregulation of VEGF pathway in pancreatic cancer. Overexpressed VEGF (Vascular endothelial growth factor) is involved in angiogenesis and is considered as a diagnostic marker for pancreatic cancer (Costache et al., 2015). These examples emphasize the importance of signaling pathways and transcriptional regulation in the context of cancer diseases.
However, next to cancer related diseases I also recovered strong associations with other disease types, e.g. upregulated Hypoxia pathway activity in rheumatoid arthritis (Quiñonez-Flores, González-Chávez, & Pacheco-Tena, 2016). Also, NFKB1 and JAK-STAT showed elevated activity in immune and, therefore, leukocyte related diseases, such as inflammation of the lung, bowel, mucous membrane, or skin (Banerjee, Biehl, Gadina, Hasni, & Schwartz, 2017; Tak & Firestein, 2001).
In the context of chronic liver disease I recovered the role of PPARA. It’s expression is reduced in hepatic stellate cells during liver fibrosis (Zardi et al., 2013). This finding is in agreement with my study as I found down regulated PPARA activity associated with the set ‘liver disease’. Moreover, reduced PPARA activity was also significantly depleted within the disease sets ‘hepatocellular carcinoma’ and ‘liver carcinoma’.
Altogether, I showed that PROGENy and DoRothEA are capable to recover known signaling pathway/TF disease association based on mice and human data.
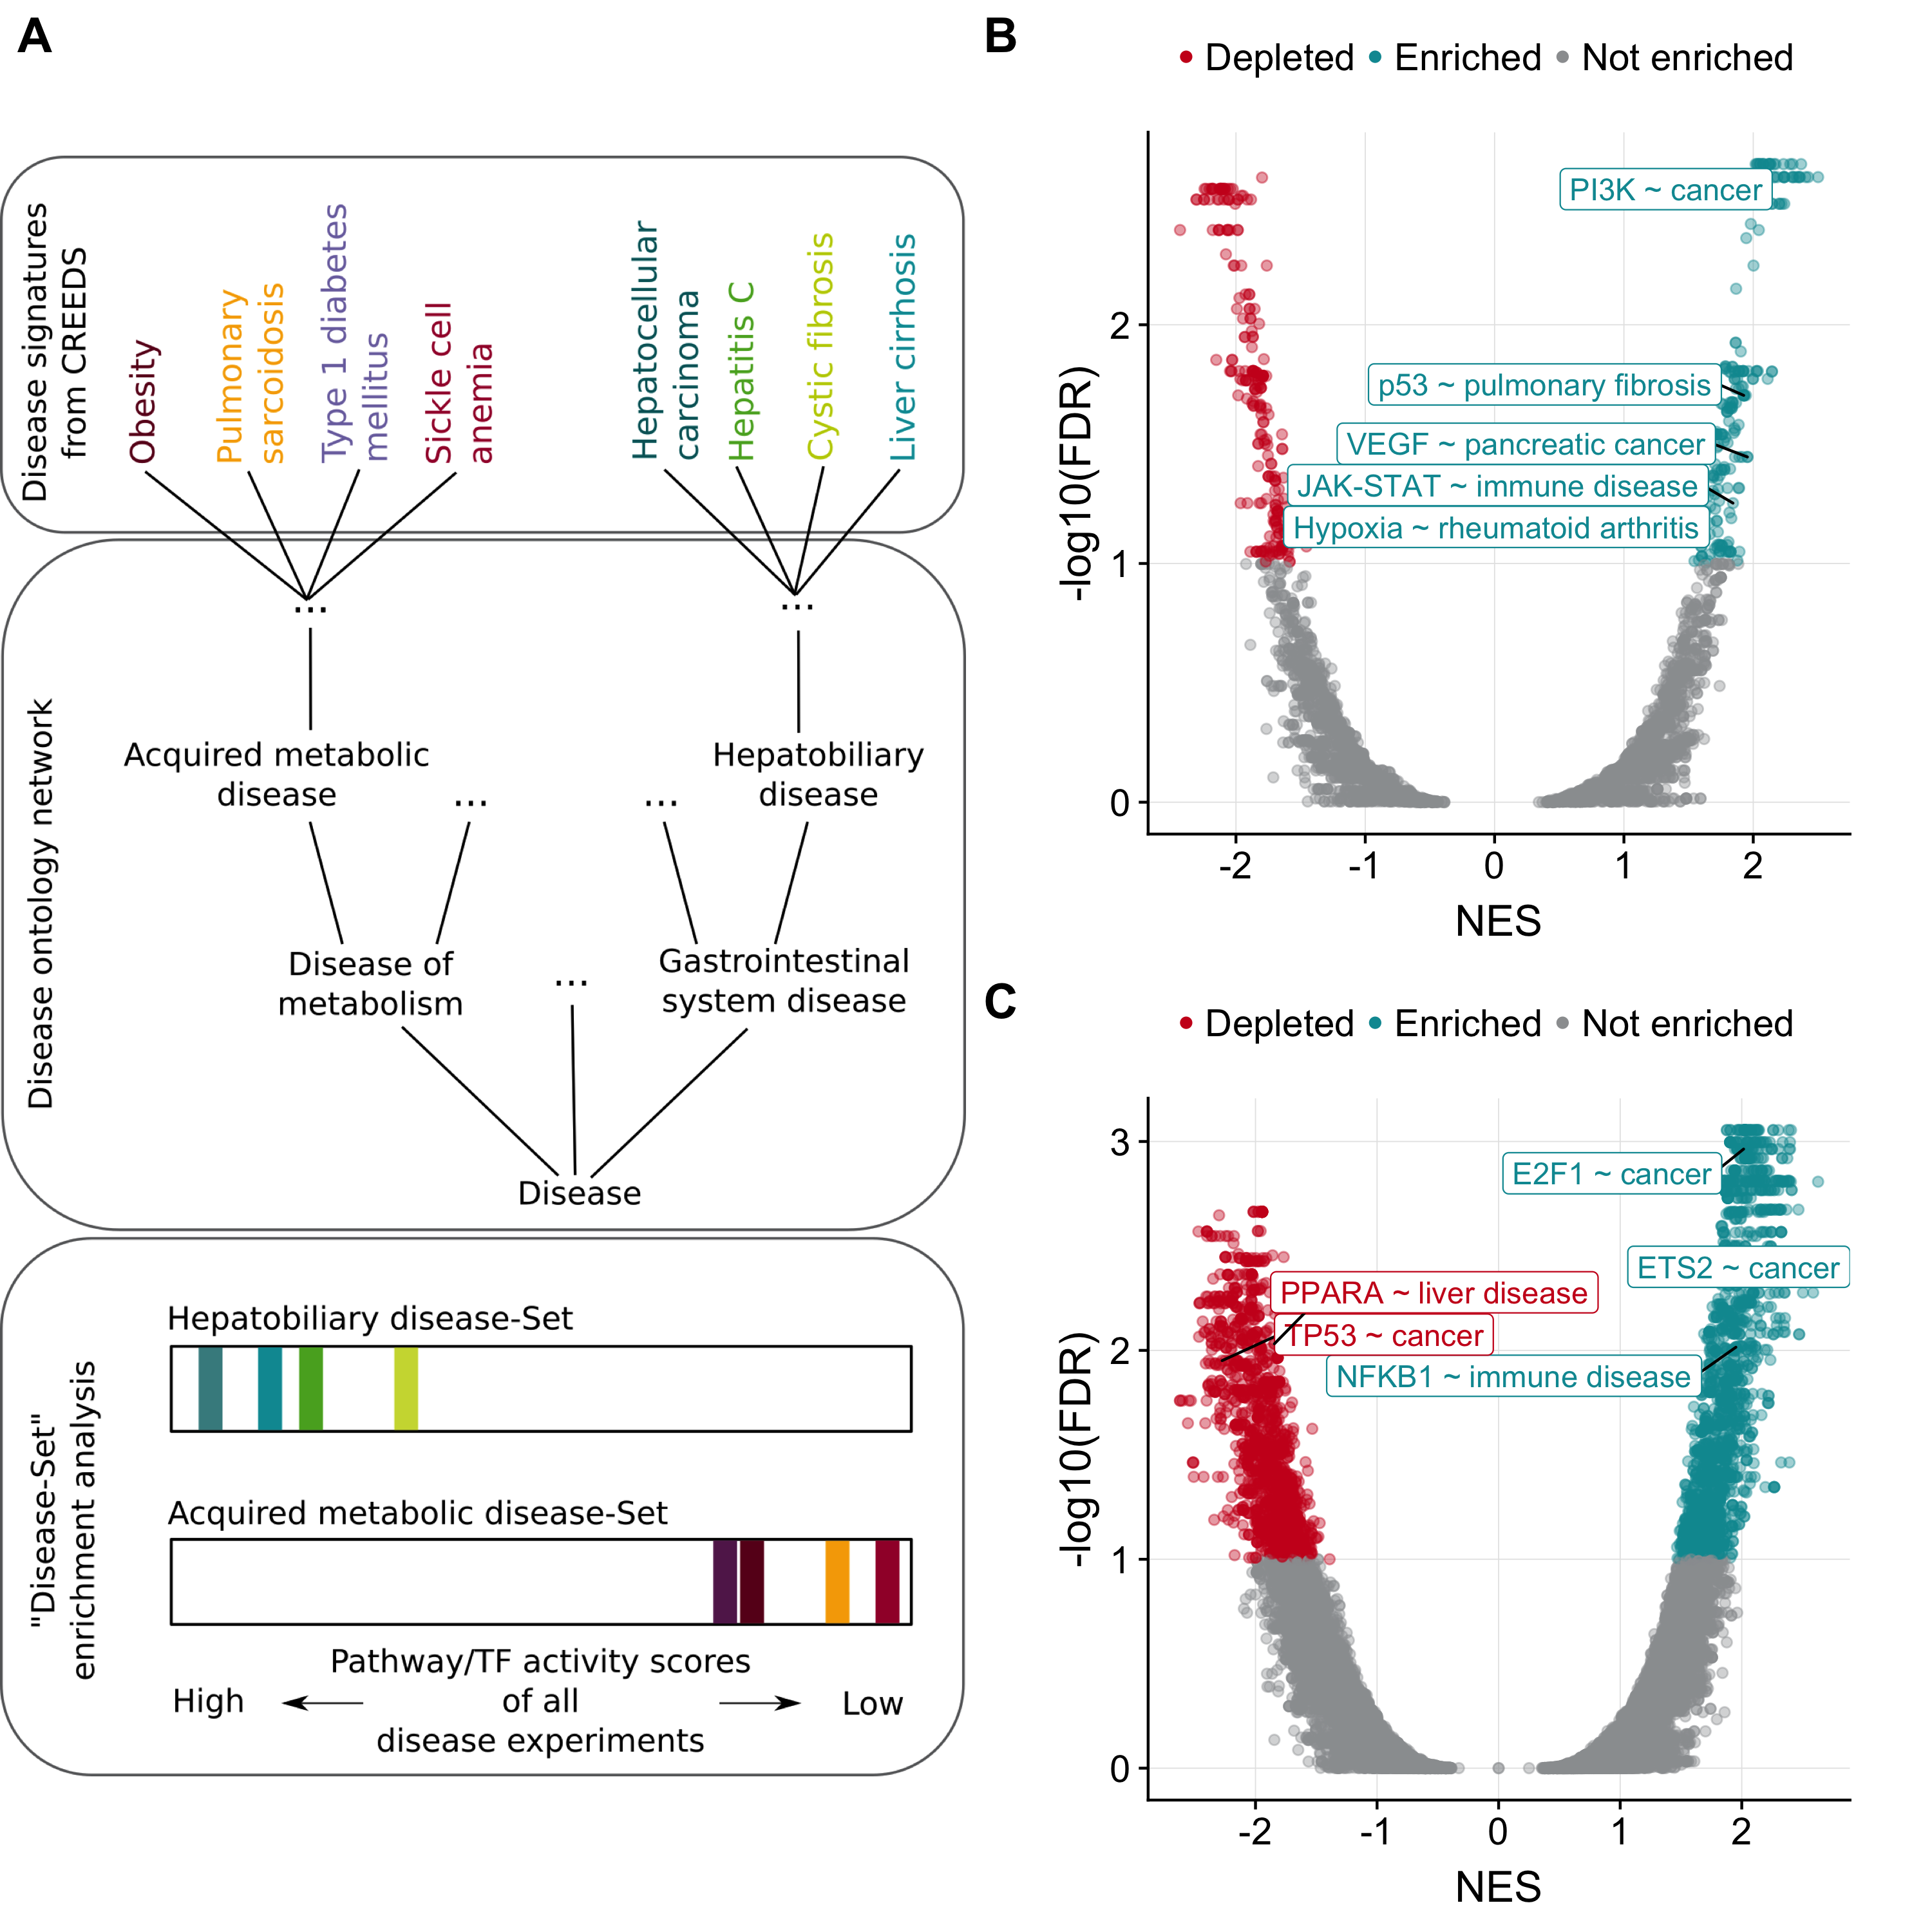
Figure 2.4: Pathway/TF-disease associations. (A) Framework of gene set enrichment adapted for ‘disease set’ enrichment. The disease sets are created based on a disease ontology network. Each node in the network represents a disease set. CREEDs diseases which are the node itself or descendants of a node are considered as corresponding disease set members. To perform the enrichment PROGENy and DoRothEA activity levels are ranked separately and checked whether a disease set is enriched either at the top or at the bottom of the ranked list. (B, C) Volcano plots showing separately for pathways and TFs the outcome of disease set enrichment. Selected associations are labelled.
2.5 Discussion
The evolutionarily conserved gene regulatory system between mouse and human suggests that the footprints of a pathway or TF on gene expression are evolutionarily conserved as well. This hypothesis has a direct impact on footprint methods developed for human application, such as PROGENy and DoRothEA. Both rely on gene sets comprising footprints and given that my assumption is true, they can be applied to mice data, which is an important resource for the study of human diseases. I addressed this question by establishing a benchmark pipeline to validate if DoRothEA and an extended version of PROGENy (footprints for Androgen, Estrogen and WNT were added by Bence Szalai) can be applied to functionally characterize mice data (Figure 2.1B).
I found that mouse-PROGENy is globally effective in inferring pathway activity on mouse data. However, the pathway-wise benchmark showed that the prediction power varies across pathways (Supplementary Figures A.1 and A.3). Especially for JAK-STAT, I saw a highly significant difference between mice and humans in ROC space for the benefit of humans (DeLong-test, p = 5e-5). Interestingly, I observed the inverse case for the pathway NFkB. Here, mouse-PROGENy tends to outperform human-PROGENy (DeLong-test, p = 0.057), while NFkB still performed well in human (Schubert et al., 2018). This difference emphasizes the importance of the quality of the benchmark data. The benchmark data in (Schubert et al., 2018) was curated very carefully by reviewing each perturbation experiment separately. My analysis is based on a broad collection of curated experiments via crowdsourcing. By their own nature, crowdsourcing projects cannot be fully controlled, and miss annotations can occur, which could contribute to the low performance I found for some pathways. Other pathways, with a low number of positive cases such as VEGF, must be interpreted with caution as reliability of ROC/PR tests decreases with decreasing positive cases.
Regarding mouse-DoRothEA, I found it’s performance comparable to dedicated mouse regulons from TRRUST. However, I recommend the use of mouse-DoRothEA instead of TRRUST as it provides a better coverage at similar performance. Regulons with confidence levels A and B have been shown to perform the best for both resources. Including confidence level C almost doubled the TF coverage from 34 to 59 TFs (Supplementary Figure A.4B) but caused a performance drop. By including TFs labelled with confidence level C, I introduce regulons in my benchmark data that have not been thoroughly studied (Garcia-Alonso et al., 2019), hence the drop in performance is expected.
Our above stated findings about the performance of PROGENy and DoRothEA support my initial hypothesis that footprints are evolutionarily conserved between mice and humans, however only indirectly. Comparative transcriptomic analysis of single drug and single gene perturbation experiments in mice and humans would be required to show this fact in a direct manner. Thus I conclude that it is reasonable to think that the footprints of a pathway or TF are evolutionarily conserved, at least at the level of my current footprint methods which rely on lists of genes.
Once shown that PROGENy and DoRothEA can also be applied to mouse data, I computed TF and pathway activities for a large collection of chemical and genetic perturbations and disease experiments. The results are provided as an interactive web application to browse corresponding pathway and TF activities. I envision that this resource can have broad applications including the study of diseases and therapeutics. Moreover, I demonstrated the usability of PROGENy and DoRothEA by recovering known pathway/TF disease associations using the aforementioned disease experiments. I found 4020 significant associations in total, where most were related to different forms of cancer, but I also recovered well-known associations of other disease types, such as liver disease (Figure 2.4B).
Finally, I believe that my finding of the conserved nature of footprints is especially interesting for further development of footprint methods. Integrating data from mice and humans will provide a much stronger data background for future model construction. Lastly, I speculate that the conserved nature of footprints will not hold to be exclusively true for mouse and human but will also extend to other mammals often used as model organisms.
2.6 Availability of data and materials
All source code is deposited at GitHub. Pathway and TF activities of perturbation and disease experiments can be browsed in a user friendly web application.